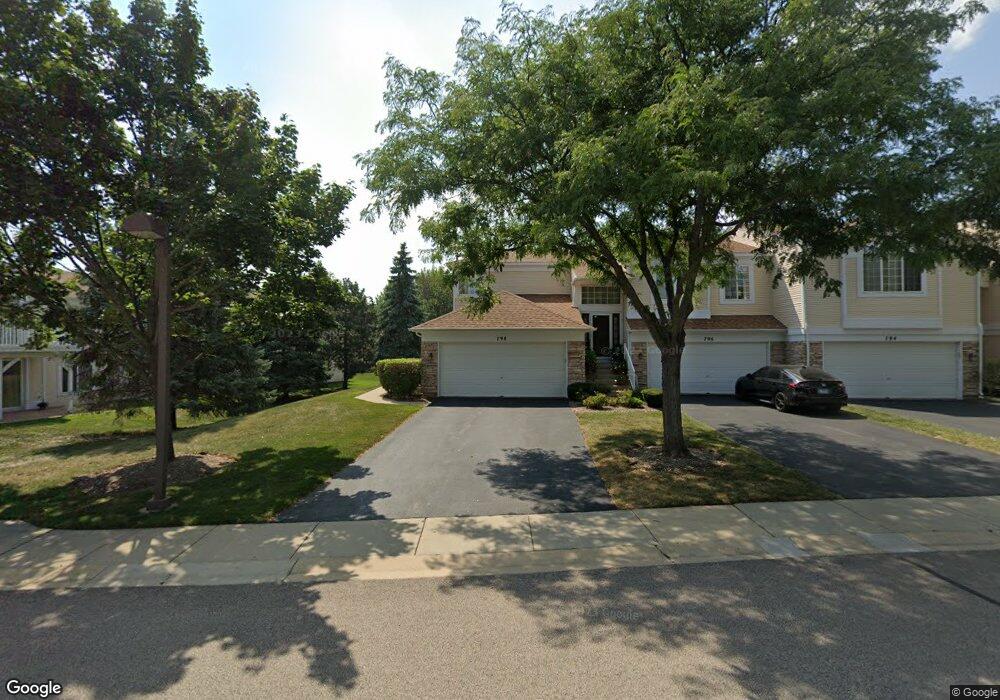
798 Mesa Dr Unit 361A Elgin, IL 60123
College Green NeighborhoodEstimated Value: $251,550 - $276,000
2
Beds
2
Baths
1,170
Sq Ft
$228/Sq Ft
Est. Value
About This Home
This home is located at 798 Mesa Dr Unit 361A, Elgin, IL 60123 and is currently estimated at $266,638, approximately $227 per square foot. 798 Mesa Dr Unit 361A is a home located in Kane County with nearby schools including Otter Creek Elementary School, Abbott Middle School, and South Elgin High School.
Ownership History
Date
Name
Owned For
Owner Type
Purchase Details
Closed on
Mar 22, 2022
Sold by
Flores Anthony J
Bought by
Flores Anthony J and Berna Heidi L
Current Estimated Value
Purchase Details
Closed on
Jan 3, 2006
Sold by
Garcia Rosa M
Bought by
Flores Anthony J and Flores Jill A
Home Financials for this Owner
Home Financials are based on the most recent Mortgage that was taken out on this home.
Original Mortgage
$84,000
Interest Rate
6.34%
Mortgage Type
Fannie Mae Freddie Mac
Purchase Details
Closed on
Dec 30, 1999
Sold by
Watkins Douglas E
Bought by
Garcia Rosa M
Home Financials for this Owner
Home Financials are based on the most recent Mortgage that was taken out on this home.
Original Mortgage
$59,000
Interest Rate
7.75%
Purchase Details
Closed on
Aug 26, 1997
Sold by
Pulte Home Corp
Bought by
Watkins Douglas E
Home Financials for this Owner
Home Financials are based on the most recent Mortgage that was taken out on this home.
Original Mortgage
$77,000
Interest Rate
7.57%
Mortgage Type
Balloon
Create a Home Valuation Report for This Property
The Home Valuation Report is an in-depth analysis detailing your home's value as well as a comparison with similar homes in the area
Home Values in the Area
Average Home Value in this Area
Purchase History
| Date | Buyer | Sale Price | Title Company |
|---|---|---|---|
| Flores Anthony J | -- | None Listed On Document | |
| Flores Anthony J | $164,000 | Greater Illinois Title Compa | |
| Garcia Rosa M | $130,000 | Chicago Title Insurance Co | |
| Watkins Douglas E | $74,666 | First American Title Ins Co |
Source: Public Records
Mortgage History
| Date | Status | Borrower | Loan Amount |
|---|---|---|---|
| Previous Owner | Flores Anthony J | $84,000 | |
| Previous Owner | Garcia Rosa M | $59,000 | |
| Previous Owner | Watkins Douglas E | $77,000 |
Source: Public Records
Tax History
| Year | Tax Paid | Tax Assessment Tax Assessment Total Assessment is a certain percentage of the fair market value that is determined by local assessors to be the total taxable value of land and additions on the property. | Land | Improvement |
|---|---|---|---|---|
| 2024 | $1,236 | $63,096 | $16,325 | $46,771 |
| 2023 | $1,317 | $57,002 | $14,748 | $42,254 |
| 2022 | $1,773 | $51,976 | $13,448 | $38,528 |
| 2021 | $1,824 | $48,594 | $12,573 | $36,021 |
| 2020 | $1,865 | $44,141 | $12,003 | $32,138 |
| 2019 | $1,910 | $42,047 | $11,434 | $30,613 |
| 2018 | $2,022 | $39,611 | $10,772 | $28,839 |
| 2017 | $2,720 | $37,446 | $10,183 | $27,263 |
| 2016 | $2,181 | $34,740 | $9,447 | $25,293 |
| 2015 | -- | $31,842 | $8,659 | $23,183 |
| 2014 | -- | $31,449 | $8,552 | $22,897 |
| 2013 | -- | $32,279 | $8,778 | $23,501 |
Source: Public Records
Map
Nearby Homes
- 2038 College Green Dr
- 651 Lancaster Cir
- 2046 Mission Hills Dr
- 938 Mesa Dr Unit 441D
- 2060 Muirfield Cir
- 974 Annandale Dr
- 821 Red Barn Ln
- 1880 Gleneagle Cir
- 611 Woodbridge Dr
- 1094 Delta Dr Unit 41A
- 1780 Pebble Beach Cir
- 1780 College Green Dr Unit 7
- 27 Frederick Ct
- 2478 Crystal Creek Ln
- 593 Covered Bridge Dr
- 1180 Delta Dr Unit 106A
- 1661 College Green Dr
- 1670 College Green Dr Unit 2
- 2375 Cove Ct Unit 143D
- 1633 Pebble Beach Cir Unit 6
- 792 Mesa Dr Unit 364C
- 796 Mesa Dr Unit 362B
- 794 Mesa Dr Unit 363D
- 794 Mesa Dr Unit 794
- 790 Mesa Dr Unit 365F
- 786 Mesa Dr Unit 351F
- 784 Mesa Dr Unit 352D
- 782 Mesa Dr Unit 353C
- 826 Coronado Ct Unit 371F
- 824 Coronado Ct Unit 372C
- 822 Coronado Ct Unit 373B
- 820 Coronado Ct Unit 374A
- 787 Verde Vista Ct Unit 594A
- 785 Verde Vista Ct Unit 593B
- 785 Verde Vista Ct Unit 785
- 783 Verde Vista Ct Unit 592C
- 781 Verde Vista Ct Unit 591F
- 801 Mesa Dr Unit 581A
- 805 Mesa Dr Unit 583F
- 803 Mesa Dr Unit 582B
Your Personal Tour Guide
Ask me questions while you tour the home.