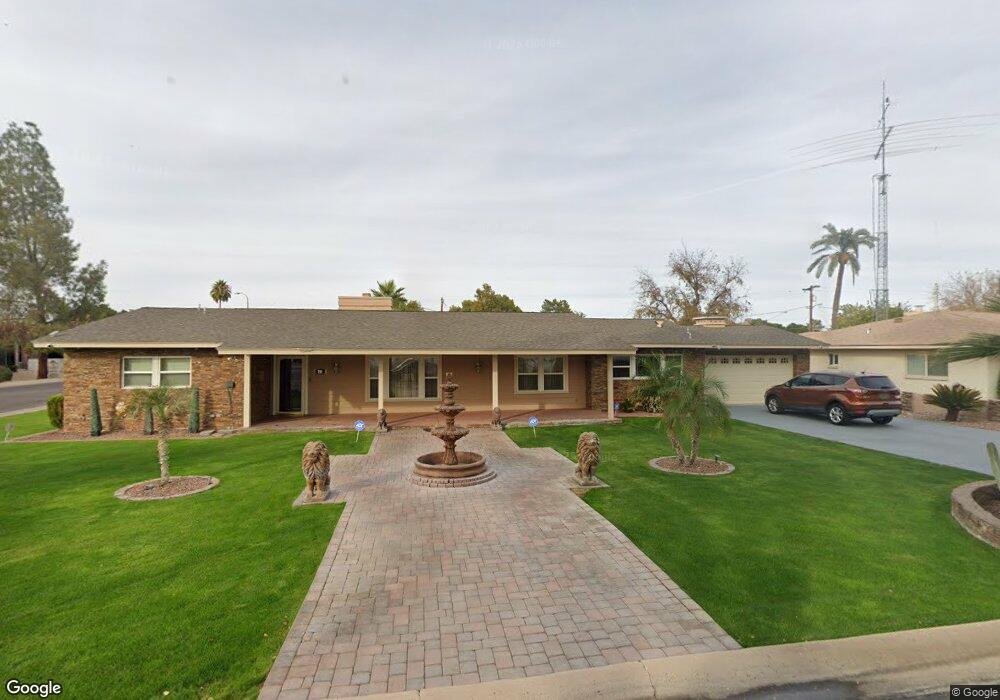
798 W Chandler Blvd Chandler, AZ 85225
Downtown Chandler NeighborhoodEstimated Value: $486,000 - $533,000
--
Bed
3
Baths
2,125
Sq Ft
$237/Sq Ft
Est. Value
About This Home
This home is located at 798 W Chandler Blvd, Chandler, AZ 85225 and is currently estimated at $503,527, approximately $236 per square foot. 798 W Chandler Blvd is a home located in Maricopa County with nearby schools including Hartford Sylvia Encinas Elementary School, Chandler High School, and Andersen Junior High School.
Ownership History
Date
Name
Owned For
Owner Type
Purchase Details
Closed on
Jun 27, 2022
Sold by
Howard Ronald B
Bought by
Smith Robert M and Smith Daniel B
Current Estimated Value
Purchase Details
Closed on
Jun 1, 2021
Sold by
Casa Arizona Investments Llc
Bought by
Howard Ronald B
Purchase Details
Closed on
Jun 2, 2005
Sold by
Howard Maribel
Bought by
Howard R Brian
Home Financials for this Owner
Home Financials are based on the most recent Mortgage that was taken out on this home.
Original Mortgage
$189,000
Interest Rate
5.37%
Mortgage Type
Purchase Money Mortgage
Purchase Details
Closed on
Jun 11, 1997
Sold by
Falletta Charlie and Falletta Erminie Hazel
Bought by
Deford David R and Deford Rebecca L
Create a Home Valuation Report for This Property
The Home Valuation Report is an in-depth analysis detailing your home's value as well as a comparison with similar homes in the area
Home Values in the Area
Average Home Value in this Area
Purchase History
| Date | Buyer | Sale Price | Title Company |
|---|---|---|---|
| Smith Robert M | $152,950 | Empire West Title | |
| Howard Ronald B | -- | Accommodation | |
| Howard R Brian | -- | Fidelity National Title | |
| Howard R Brian | $270,000 | Fidelity National Title | |
| Deford David R | $115,000 | Transnation Title Ins Co |
Source: Public Records
Mortgage History
| Date | Status | Borrower | Loan Amount |
|---|---|---|---|
| Previous Owner | Howard R Brian | $189,000 |
Source: Public Records
Tax History Compared to Growth
Tax History
| Year | Tax Paid | Tax Assessment Tax Assessment Total Assessment is a certain percentage of the fair market value that is determined by local assessors to be the total taxable value of land and additions on the property. | Land | Improvement |
|---|---|---|---|---|
| 2025 | $1,007 | $13,106 | -- | -- |
| 2024 | $986 | $12,481 | -- | -- |
| 2023 | $986 | $36,970 | $7,390 | $29,580 |
| 2022 | $1,145 | $29,060 | $5,810 | $23,250 |
| 2021 | $1,177 | $26,920 | $5,380 | $21,540 |
| 2020 | $1,171 | $25,830 | $5,160 | $20,670 |
| 2019 | $1,130 | $21,880 | $4,370 | $17,510 |
| 2018 | $1,098 | $19,380 | $3,870 | $15,510 |
| 2017 | $1,031 | $18,470 | $3,690 | $14,780 |
| 2016 | $996 | $17,580 | $3,510 | $14,070 |
| 2015 | $955 | $14,570 | $2,910 | $11,660 |
Source: Public Records
Map
Nearby Homes
- 515 W Toledo St
- 518 N Cheri Lynn Dr
- The Bower Plan at San Marcos
- Floor Plan 2 at San Marcos
- Floor Plan 1 at San Marcos
- 337 N Comanche Dr
- 644 N Vine St
- 635 N Vine St
- 651 W Laredo St
- 660 W Laredo St
- 640 W Laredo St
- 121 N California St Unit 35
- 389 W Fairway Place
- 121 W Galveston St
- 1293 W Toledo St
- 815 N Evergreen St
- 751 W Saragosa St
- 843 N Jay St
- 630 W Saragosa St
- 291 N Washington St
- 774 W Chandler Blvd
- 799 W Toledo St
- 787 W Toledo St
- 762 W Chandler Blvd
- 775 W Toledo St
- 763 W Toledo St
- 264 N Evergreen St
- 738 W Chandler Blvd
- 749 W Toledo St
- 270 N Evergreen St
- 739 W Toledo St
- 801 W Toledo St
- 798 W Toledo St
- 786 W Toledo St
- 274 N Evergreen St
- 726 W Chandler Blvd
- 772 W Toledo St
- 800 W Toledo St
- 762 W Toledo St
- 278 N Evergreen St