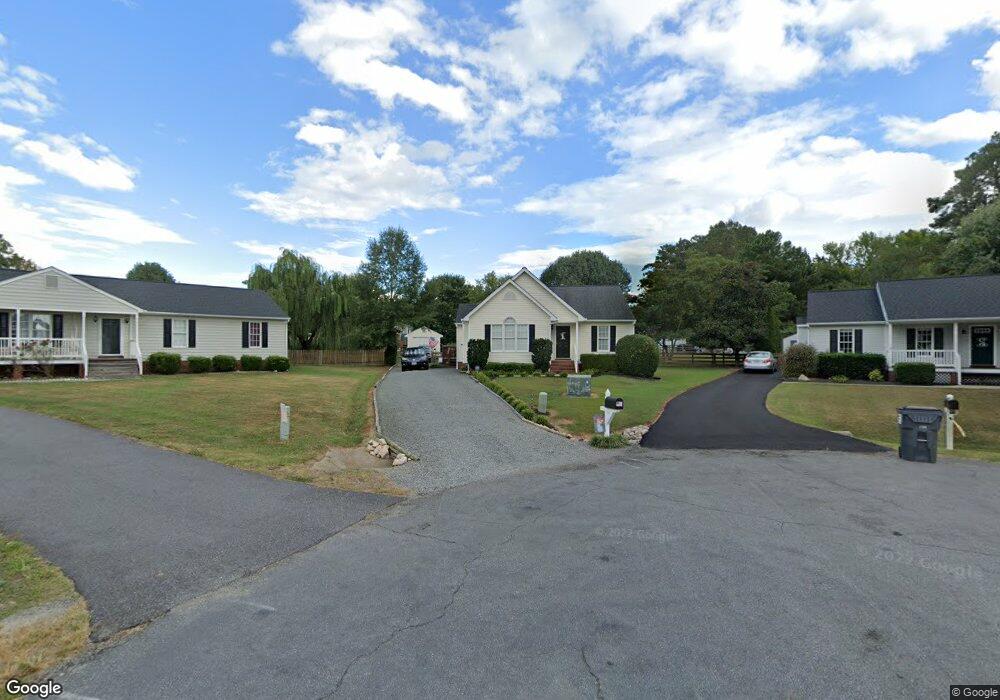
7980 Loganberry Ct Mechanicsville, VA 23111
Estimated Value: $343,000 - $356,000
3
Beds
2
Baths
1,341
Sq Ft
$261/Sq Ft
Est. Value
About This Home
This home is located at 7980 Loganberry Ct, Mechanicsville, VA 23111 and is currently estimated at $349,779, approximately $260 per square foot. 7980 Loganberry Ct is a home located in Hanover County with nearby schools including Washington-Henry Elementary School, Chickahominy Middle School, and Atlee High School.
Ownership History
Date
Name
Owned For
Owner Type
Purchase Details
Closed on
May 25, 2004
Sold by
Salmon Partners L C
Bought by
Kelley Michael
Current Estimated Value
Home Financials for this Owner
Home Financials are based on the most recent Mortgage that was taken out on this home.
Original Mortgage
$156,543
Outstanding Balance
$75,908
Interest Rate
5.88%
Mortgage Type
FHA
Estimated Equity
$273,871
Purchase Details
Closed on
Dec 26, 2001
Sold by
Kay Duane T
Bought by
Salmon Stephen A
Home Financials for this Owner
Home Financials are based on the most recent Mortgage that was taken out on this home.
Original Mortgage
$105,600
Interest Rate
6.61%
Purchase Details
Closed on
Aug 3, 1999
Sold by
Va Craft Homes
Bought by
Kay Duane T
Home Financials for this Owner
Home Financials are based on the most recent Mortgage that was taken out on this home.
Original Mortgage
$123,160
Interest Rate
7.85%
Create a Home Valuation Report for This Property
The Home Valuation Report is an in-depth analysis detailing your home's value as well as a comparison with similar homes in the area
Home Values in the Area
Average Home Value in this Area
Purchase History
| Date | Buyer | Sale Price | Title Company |
|---|---|---|---|
| Kelley Michael | $159,000 | -- | |
| Salmon Stephen A | $129,000 | -- | |
| Kay Duane T | $123,235 | -- |
Source: Public Records
Mortgage History
| Date | Status | Borrower | Loan Amount |
|---|---|---|---|
| Open | Kelley Michael | $156,543 | |
| Previous Owner | Salmon Stephen A | $105,600 | |
| Previous Owner | Kay Duane T | $123,160 |
Source: Public Records
Tax History Compared to Growth
Tax History
| Year | Tax Paid | Tax Assessment Tax Assessment Total Assessment is a certain percentage of the fair market value that is determined by local assessors to be the total taxable value of land and additions on the property. | Land | Improvement |
|---|---|---|---|---|
| 2025 | $2,446 | $302,000 | $85,000 | $217,000 |
| 2024 | $2,379 | $293,700 | $85,000 | $208,700 |
| 2023 | $2,129 | $276,500 | $80,000 | $196,500 |
| 2022 | $2,063 | $254,700 | $75,000 | $179,700 |
| 2021 | $1,910 | $235,800 | $70,000 | $165,800 |
| 2020 | $1,780 | $219,700 | $65,000 | $154,700 |
| 2019 | $1,468 | $219,700 | $65,000 | $154,700 |
| 2018 | $1,468 | $181,200 | $55,000 | $126,200 |
| 2017 | $1,468 | $181,200 | $55,000 | $126,200 |
| 2016 | $1,468 | $181,200 | $55,000 | $126,200 |
| 2015 | $1,468 | $181,200 | $55,000 | $126,200 |
| 2014 | $1,331 | $164,300 | $55,000 | $109,300 |
Source: Public Records
Map
Nearby Homes
- 8382 Timberlake Green Dr
- 8322 Waldron Way
- 8282 Tangle Pond Ln
- 8033 Ellerson Wood Dr
- 8259 Franklin Ln
- 8043 Atlee Rd
- 8236 Meadowview Ln
- 8183 Burnside Ct
- 8237 Silkwood Dr
- 7365 Sunshine Ct
- 8096 Saddle Crest Dr
- 8179 Holly Ln
- 8212 Shady Grove Rd
- 7770 Secret Knoll Terrace
- 7754 Secret Knoll Terrace
- 7762 Secret Knoll Terrace
- 7766 Secret Knoll Terrace
- 7758 Secret Knoll Terrace
- 7774 Secret Knoll Terrace
- 7786 Secret Knoll Terrace
- 7979 Loganberry Ct
- 7984 Loganberry Ct
- 7967 Baneberry Dr
- 7985 Loganberry Ct
- 7963 Baneberry Dr
- 7988 Loganberry Ct
- 8407 Apricot Ln
- 8422 Ellerson Dr
- 8403 Apricot Ln
- 7989 Loganberry Ct
- 8373 Mary Mundie Ln
- 7959 Baneberry Dr
- 8430 Ellerson Dr
- 8438 Ellerson Dr
- 8393 Mary Mundie Ln
- 8386 Mary Mundie Ln
- 8382 Mary Mundie Ln
- 7955 Baneberry Dr
- 8390 Mary Mundie Ln
- 7966 Baneberry Dr