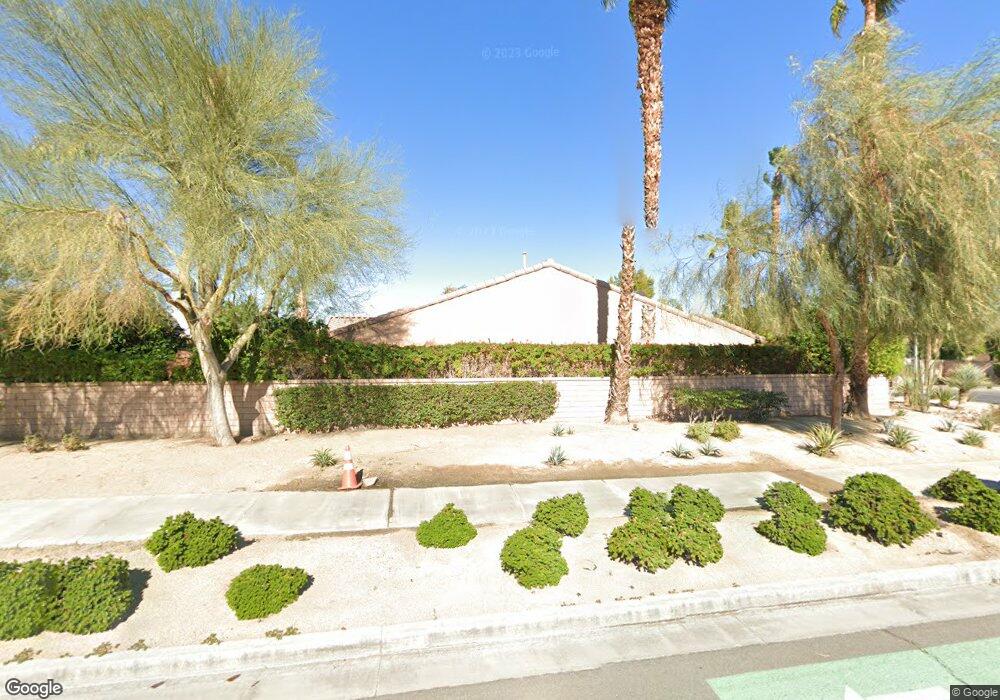
79811 Cassia St La Quinta, CA 92253
Estimated Value: $450,000 - $659,000
3
Beds
3
Baths
1,760
Sq Ft
$323/Sq Ft
Est. Value
About This Home
This home is located at 79811 Cassia St, La Quinta, CA 92253 and is currently estimated at $569,278, approximately $323 per square foot. 79811 Cassia St is a home located in Riverside County with nearby schools including Harry S. Truman Elementary School, La Quinta Middle School, and La Quinta High School.
Ownership History
Date
Name
Owned For
Owner Type
Purchase Details
Closed on
Nov 27, 2001
Sold by
Dc & Tc Llc
Bought by
Ponce Alvino and Ponce Martha
Current Estimated Value
Home Financials for this Owner
Home Financials are based on the most recent Mortgage that was taken out on this home.
Original Mortgage
$140,790
Outstanding Balance
$55,014
Interest Rate
6.57%
Mortgage Type
FHA
Estimated Equity
$514,264
Create a Home Valuation Report for This Property
The Home Valuation Report is an in-depth analysis detailing your home's value as well as a comparison with similar homes in the area
Home Values in the Area
Average Home Value in this Area
Purchase History
| Date | Buyer | Sale Price | Title Company |
|---|---|---|---|
| Ponce Alvino | $143,000 | Stewart Title |
Source: Public Records
Mortgage History
| Date | Status | Borrower | Loan Amount |
|---|---|---|---|
| Open | Ponce Alvino | $140,790 | |
| Closed | Ponce Alvino | $8,719 |
Source: Public Records
Tax History Compared to Growth
Tax History
| Year | Tax Paid | Tax Assessment Tax Assessment Total Assessment is a certain percentage of the fair market value that is determined by local assessors to be the total taxable value of land and additions on the property. | Land | Improvement |
|---|---|---|---|---|
| 2025 | $3,205 | $211,220 | $44,300 | $166,920 |
| 2023 | $3,205 | $203,021 | $42,581 | $160,440 |
| 2022 | $2,966 | $199,042 | $41,747 | $157,295 |
| 2021 | $2,882 | $195,140 | $40,929 | $154,211 |
| 2020 | $2,832 | $193,140 | $40,510 | $152,630 |
| 2019 | $2,774 | $189,354 | $39,716 | $149,638 |
| 2018 | $2,710 | $185,642 | $38,938 | $146,704 |
| 2017 | $2,677 | $182,003 | $38,175 | $143,828 |
| 2016 | $2,636 | $178,435 | $37,427 | $141,008 |
| 2015 | $2,640 | $175,757 | $36,866 | $138,891 |
| 2014 | $2,600 | $172,316 | $36,145 | $136,171 |
Source: Public Records
Map
Nearby Homes
- 79756 Cassia St
- 79770 Mira Flores Blvd
- 79760 Rancho la Quinta Dr
- 79840 Rancho la Quinta Dr
- 48250 Vista Calico
- 80076 Bridgeport Dr
- 80000 Ave 48 Unit 291
- 80000 Avenue 48 Unit 58
- 80000 Ave 48 Unit 163
- 49500 Seagull
- 49480 Seagull
- 49460 Seagull
- 49400 Seagull
- 47340 Jefferson St Unit 289
- 80144 Barcelona Ave
- 47635 Soft Moonlight
- 47615 Soft Moonlight
- 79320 Rose Dawn
- 48674 Acropolis St
- 47788 Dancing Butterfly
- 79795 Cassia St
- 47905 Bougainvillea St
- 79835 Cassia St
- 47900 Rosemary St
- 79779 Cassia St
- 47900 Bougainvillea St
- 47875 Bougainvillea St
- 47870 Rosemary St
- 79851 Cassia St
- 47905 Rosemary St
- 79763 Cassia St
- 47905 Silverberry St
- 47870 Bougainvillea St
- 47845 Bougainvillea St
- 47840 Rosemary St
- 79867 Cassia St
- 79747 Cassia St
- 47840 Bougainvillea St
- 47845 Rosemary St
- 79735 Mira Flores Blvd