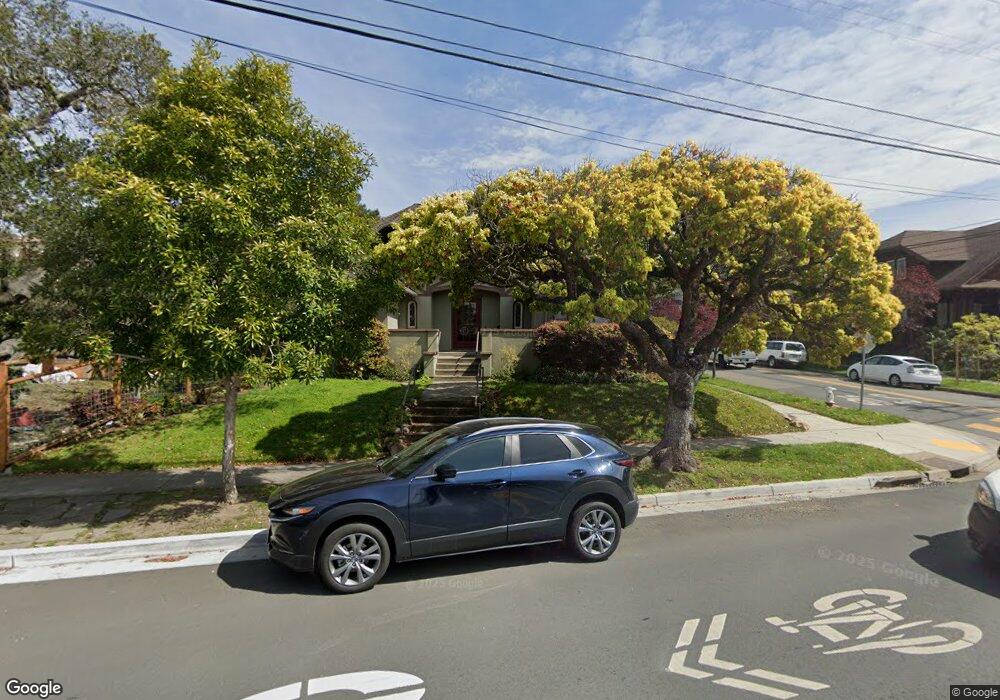
799 Colusa Ave Berkeley, CA 94707
Thousand Oaks NeighborhoodEstimated Value: $1,638,000 - $1,860,000
3
Beds
2
Baths
1,744
Sq Ft
$991/Sq Ft
Est. Value
About This Home
This home is located at 799 Colusa Ave, Berkeley, CA 94707 and is currently estimated at $1,728,513, approximately $991 per square foot. 799 Colusa Ave is a home located in Alameda County with nearby schools including Thousand Oaks Elementary School, Ruth Acty Elementary, and Berkeley Arts Magnet at Whittier School.
Ownership History
Date
Name
Owned For
Owner Type
Purchase Details
Closed on
Jun 19, 2017
Sold by
Lopus Lyle L and Lopus Jane E
Bought by
Lopus Lyle L and Lopus Jane E
Current Estimated Value
Purchase Details
Closed on
Jun 9, 2004
Sold by
Guenther Susan and Hindersinn Kenneth Jeffrey
Bought by
Lopus Lyle L and Lopus Jane E
Home Financials for this Owner
Home Financials are based on the most recent Mortgage that was taken out on this home.
Original Mortgage
$323,700
Interest Rate
6.09%
Mortgage Type
Purchase Money Mortgage
Purchase Details
Closed on
Jun 22, 2001
Sold by
Walker Carolyn E
Bought by
Walker Carolyn E and Carolyn E Walker Revocable Tru
Create a Home Valuation Report for This Property
The Home Valuation Report is an in-depth analysis detailing your home's value as well as a comparison with similar homes in the area
Home Values in the Area
Average Home Value in this Area
Purchase History
| Date | Buyer | Sale Price | Title Company |
|---|---|---|---|
| Lopus Lyle L | -- | None Available | |
| Lopus Lyle L | $804,000 | Placer Title Company | |
| Walker Carolyn E | -- | -- |
Source: Public Records
Mortgage History
| Date | Status | Borrower | Loan Amount |
|---|---|---|---|
| Previous Owner | Lopus Lyle L | $323,700 | |
| Closed | Lopus Lyle L | $319,500 |
Source: Public Records
Tax History
| Year | Tax Paid | Tax Assessment Tax Assessment Total Assessment is a certain percentage of the fair market value that is determined by local assessors to be the total taxable value of land and additions on the property. | Land | Improvement |
|---|---|---|---|---|
| 2025 | $10,617 | $581,519 | $200,968 | $387,551 |
| 2024 | $10,617 | $569,982 | $197,029 | $379,953 |
| 2023 | $10,375 | $565,668 | $193,165 | $372,503 |
| 2022 | $10,146 | $547,578 | $189,378 | $365,200 |
| 2021 | $10,142 | $536,708 | $185,666 | $358,042 |
| 2020 | $9,498 | $538,137 | $183,764 | $354,373 |
| 2019 | $9,016 | $527,585 | $180,160 | $347,425 |
| 2018 | $8,839 | $517,240 | $176,628 | $340,612 |
| 2017 | $8,517 | $507,099 | $173,165 | $333,934 |
| 2016 | $8,171 | $497,155 | $169,769 | $327,386 |
| 2015 | $8,049 | $489,687 | $167,219 | $322,468 |
| 2014 | $7,915 | $480,096 | $163,944 | $316,152 |
Source: Public Records
Map
Nearby Homes
- 753 Peralta Ave
- 1983 Yosemite Rd
- 731 Santa fe Ave
- 415 Berkeley Park Blvd
- 765 San Diego Rd
- 813 San Diego Rd
- 589 San Luis Rd
- 1498 Sonoma Ave
- 770 Santa Barbara Rd
- 826 Indian Rock Ave
- 118 Ramona Ave
- 483 Boynton Ave
- 758 Spruce St
- 1950 Hopkins St
- 1266 Washington Ave
- 840 Key Route Blvd
- 145 Ramona Ave
- 1036 Ramona Ave
- 777 Cragmont Ave
- 1509 Francis St
- 1807 Capistrano Ave
- 775 Colusa Ave
- 1811 Capistrano Ave
- 1810 San Lorenzo Ave
- 1818 San Lorenzo Ave
- 1800 San Lorenzo Ave
- 1791 Capistrano Ave
- 801 Colusa Ave
- 1824 San Lorenzo Ave
- 1817 Capistrano Ave
- 802 Colusa Ave
- 1812 Capistrano Ave
- 758 Colusa Ave
- 1781 Capistrano Ave
- 1830 San Lorenzo Ave
- 805 Colusa Ave
- 1821 Capistrano Ave
- 816 Colusa Ave
- 1794 San Lorenzo Ave
- 1834 San Lorenzo Ave
Your Personal Tour Guide
Ask me questions while you tour the home.