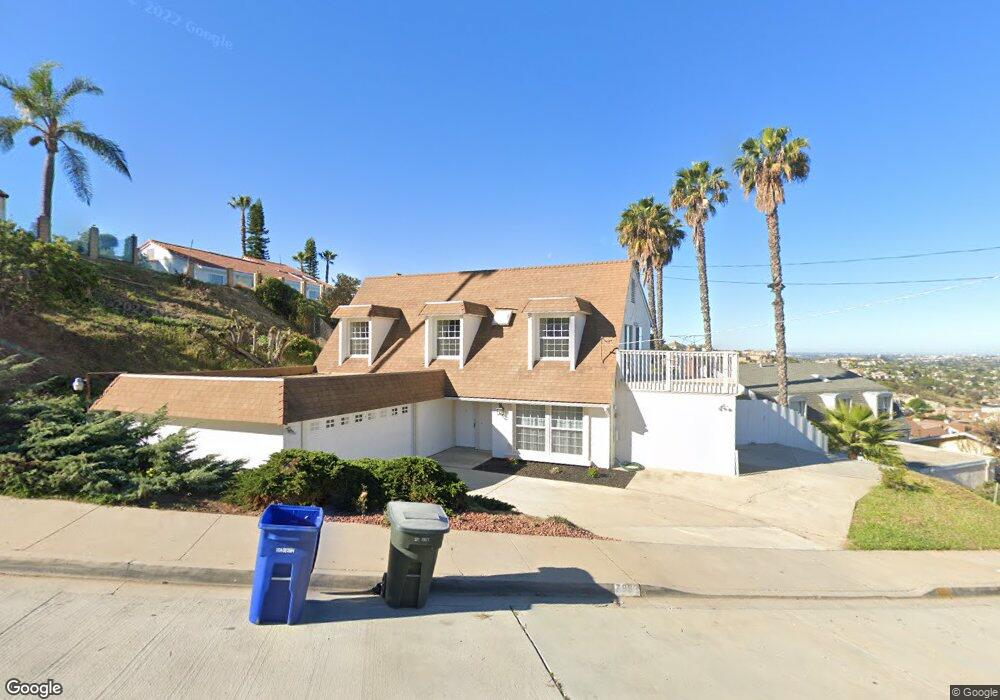
7993 Cinthia St La Mesa, CA 91941
Estimated Value: $1,172,000 - $1,335,299
5
Beds
3
Baths
2,526
Sq Ft
$501/Sq Ft
Est. Value
About This Home
This home is located at 7993 Cinthia St, La Mesa, CA 91941 and is currently estimated at $1,265,325, approximately $500 per square foot. 7993 Cinthia St is a home located in San Diego County with nearby schools including La Mesa Arts Academy, La Mesa Dale Elementary School, and Mount Miguel High School.
Ownership History
Date
Name
Owned For
Owner Type
Purchase Details
Closed on
Jan 29, 2021
Sold by
Lemay Moses
Bought by
Lemay Moses and The Moses Lemay Jr Trust
Current Estimated Value
Home Financials for this Owner
Home Financials are based on the most recent Mortgage that was taken out on this home.
Original Mortgage
$255,100
Outstanding Balance
$229,704
Interest Rate
3.1%
Mortgage Type
New Conventional
Estimated Equity
$1,035,621
Purchase Details
Closed on
Dec 24, 1999
Sold by
Moses Lemay
Bought by
Lemay Moses
Purchase Details
Closed on
Aug 8, 1994
Sold by
Heuberger Nathan A and Heuberger Mary C
Bought by
Lemay Moses
Home Financials for this Owner
Home Financials are based on the most recent Mortgage that was taken out on this home.
Original Mortgage
$188,000
Interest Rate
8.37%
Create a Home Valuation Report for This Property
The Home Valuation Report is an in-depth analysis detailing your home's value as well as a comparison with similar homes in the area
Home Values in the Area
Average Home Value in this Area
Purchase History
| Date | Buyer | Sale Price | Title Company |
|---|---|---|---|
| Lemay Moses | -- | None Available | |
| Lemay Moses | -- | Amrock Inc | |
| Lemay Moses | -- | -- | |
| Lemay Moses | $235,000 | California Coast Title Compa |
Source: Public Records
Mortgage History
| Date | Status | Borrower | Loan Amount |
|---|---|---|---|
| Open | Lemay Moses | $255,100 | |
| Closed | Lemay Moses | $188,000 | |
| Closed | Lemay Moses | $23,500 |
Source: Public Records
Tax History Compared to Growth
Tax History
| Year | Tax Paid | Tax Assessment Tax Assessment Total Assessment is a certain percentage of the fair market value that is determined by local assessors to be the total taxable value of land and additions on the property. | Land | Improvement |
|---|---|---|---|---|
| 2025 | $5,467 | $416,568 | $126,473 | $290,095 |
| 2024 | $5,467 | $408,401 | $123,994 | $284,407 |
| 2023 | $5,350 | $400,394 | $121,563 | $278,831 |
| 2022 | $5,320 | $392,544 | $119,180 | $273,364 |
| 2021 | $5,286 | $384,848 | $116,844 | $268,004 |
| 2020 | $5,086 | $380,902 | $115,646 | $265,256 |
| 2019 | $4,949 | $373,434 | $113,379 | $260,055 |
| 2018 | $4,820 | $366,112 | $111,156 | $254,956 |
| 2017 | $4,826 | $358,934 | $108,977 | $249,957 |
| 2016 | $4,716 | $351,897 | $106,841 | $245,056 |
| 2015 | $4,732 | $346,613 | $105,237 | $241,376 |
| 2014 | $4,653 | $339,824 | $103,176 | $236,648 |
Source: Public Records
Map
Nearby Homes
- 8007 Wetherly St
- 7977 Wetherly St
- 0 Eastridge Dr Unit WS21258579
- 7520 High St
- 7790 La Mesa Summit Dr
- 8022 High St
- 7795 La Mesa Summit Dr
- 7760 La Mesa Summit Dr
- 4145 Olive Ave
- 4464 Maple Ave
- 8268 High St
- 8296 High St
- 8294 High St
- 7630 Normal Ave
- 3812 Costa Bella Way
- 8166 Lemon Grove Way Unit B
- 8186 Lemon Grove Way Unit E
- 8144 Lemon Grove Way Unit B
- 4210 Black Mountain Rd
- 4475 Dale Ave Unit 106
- 7983 Cinthia St
- 7980 Eastridge Dr
- 7990 Eastridge Dr
- 7970 Eastridge Dr
- 7963 Cinthia St
- 7988 Cinthia St
- 7978 Cinthia St
- 7994 Cinthia St
- 8010 Eastridge Dr
- 7968 Cinthia St
- 7953 Cinthia St
- 7960 Eastridge Dr
- 7981 Eastridge Dr
- 8017 Wetherley St
- 7958 Cinthia St
- 7969 Eastridge Dr
- 8020 Eastridge Dr
- 7991 Eastridge Dr
- 8007 Wetherley St
- 4085 Corolyn Dr