
Landlord's Agent in 2013
Amber Fuller-McDade
Realty Boulevard
(775) 247-8123
2 in this area
32 Total Sales
Estimated Value: $962,694 - $1,336,000
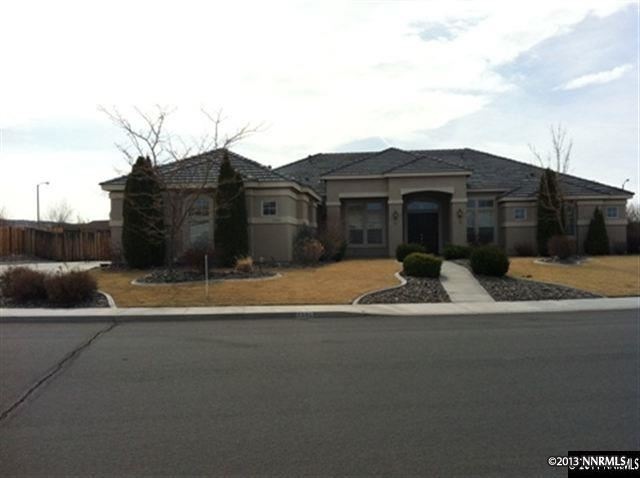
This executive 4 bedroom and 3 bath home with a full office, a separate bonus room (could be used as a 5th bedroom) and an oversized three car attached garage located in Wingfield Springs is ready the first week of August. This stunning home features a master suite like no other! The master suite covers one wing of the home with a separate patio, his/her's walk in closets, jetted tub, separate shower, dual vanities, grand formal living and dining room and a large family room with a relaxing fireplace., There is plenty of room to entertain in this open kitchen with granite counter tops, double oven, wine rack, center island with a separate sink and lots of cupboard space. There is also a great back yard and professional landscaping that’s included in the rent. The lease terms is 6-8 months only. Don't miss your chance to call this place home. Call today to schedule a showing to view this beautiful executive home!
Last Agent to Rent the Property
Realty Boulevard License #B.1000666 Listed on: 07/09/2013
| Date | Buyer | Sale Price | Title Company |
|---|---|---|---|
| Cook Family Trust | -- | -- | |
| Cook Charles R | $380,000 | First American Title Reno | |
| Demick Marlene R | -- | None Available | |
| Demick Marlene R | $365,000 | Ticor Title Reno | |
| Reams Jack L | $364,500 | First American Title |
| Date | Status | Borrower | Loan Amount |
|---|---|---|---|
| Previous Owner | Cook Charles R | $304,000 | |
| Previous Owner | Demick Marlene R | $292,000 | |
| Previous Owner | Reams Jack L | $23,000 | |
| Previous Owner | Reams Jack L | $600,000 | |
| Previous Owner | Reams Jack L | $100,000 | |
| Previous Owner | Reams Jack L | $444,000 | |
| Previous Owner | Reams Jack L | $22,650 | |
| Previous Owner | Reams Jack L | $339,750 | |
| Previous Owner | Reams Jack L | $291,300 |
| Date | Event | Price | Change | Sq Ft Price |
|---|---|---|---|---|
| 07/12/2013 07/12/13 | Rented | $1,950 | 0.0% | -- |
| 07/12/2013 07/12/13 | Under Contract | -- | -- | -- |
| 07/09/2013 07/09/13 | For Rent | $1,950 | -11.4% | -- |
| 07/23/2012 07/23/12 | Rented | $2,200 | 0.0% | -- |
| 07/23/2012 07/23/12 | Under Contract | -- | -- | -- |
| 03/30/2012 03/30/12 | For Rent | $2,200 | 0.0% | -- |
| 03/09/2012 03/09/12 | Sold | $380,000 | -4.8% | $106 / Sq Ft |
| 02/10/2012 02/10/12 | Pending | -- | -- | -- |
| 01/23/2012 01/23/12 | For Sale | $399,000 | -- | $111 / Sq Ft |
| Year | Tax Paid | Tax Assessment Tax Assessment Total Assessment is a certain percentage of the fair market value that is determined by local assessors to be the total taxable value of land and additions on the property. | Land | Improvement |
|---|---|---|---|---|
| 2025 | $5,778 | $230,940 | $55,125 | $175,816 |
| 2024 | $5,778 | $228,990 | $51,660 | $177,330 |
| 2023 | $5,611 | $225,993 | $59,395 | $166,598 |
| 2022 | $5,406 | $190,374 | $51,415 | $138,959 |
| 2021 | $5,249 | $184,169 | $45,885 | $138,284 |
| 2020 | $5,094 | $180,861 | $42,175 | $138,686 |
| 2019 | $4,948 | $175,884 | $42,070 | $133,814 |
| 2018 | $4,804 | $160,028 | $29,260 | $130,768 |
| 2017 | $4,663 | $163,208 | $31,920 | $131,288 |
| 2016 | $4,544 | $161,295 | $28,490 | $132,805 |
| 2015 | $4,462 | $146,649 | $22,680 | $123,969 |
| 2014 | $4,329 | $131,492 | $22,610 | $108,882 |
| 2013 | -- | $115,893 | $17,710 | $98,183 |
Landlord's Agent in 2013
Amber Fuller-McDade
Realty Boulevard
(775) 247-8123
2 in this area
32 Total Sales
T
Seller's Agent in 2012
Tammy Noble
Krch Realty
J
Buyer's Agent in 2012
Johnell Gant
Jenuane Communities
Source: Northern Nevada Regional MLS
MLS Number: 130008303
APN: 524-332-01
Disclaimer: Certain information contained herein is derived from information provided by parties other than Homes.com. All information provided is deemed reliable, but is not guaranteed to be accurate and should be independently verified.
![]() IDX information is provided exclusively for personal, non-commercial use, and may not be used for any purpose other than to identify prospective properties consumers may be interested in purchasing. Information is deemed reliable but not guaranteed. The content relating to real estate for sale on this web site comes in part from the Broker Reciprocity/ IDX program of the Northern Nevada Regional Multiple Listing Service°. Real estate listings held by brokerage firms other than Ten-X are marked with the Broker Reciprocity logo and detailed information about those listings includes the name of the listing brokerage. Any use of the content other than by a search performed by a consumer looking to purchase or rent real estate is prohibited. © 2025 Northern Nevada Regional Multiple Listing Service® MLS. All rights reserved.
IDX information is provided exclusively for personal, non-commercial use, and may not be used for any purpose other than to identify prospective properties consumers may be interested in purchasing. Information is deemed reliable but not guaranteed. The content relating to real estate for sale on this web site comes in part from the Broker Reciprocity/ IDX program of the Northern Nevada Regional Multiple Listing Service°. Real estate listings held by brokerage firms other than Ten-X are marked with the Broker Reciprocity logo and detailed information about those listings includes the name of the listing brokerage. Any use of the content other than by a search performed by a consumer looking to purchase or rent real estate is prohibited. © 2025 Northern Nevada Regional Multiple Listing Service® MLS. All rights reserved.