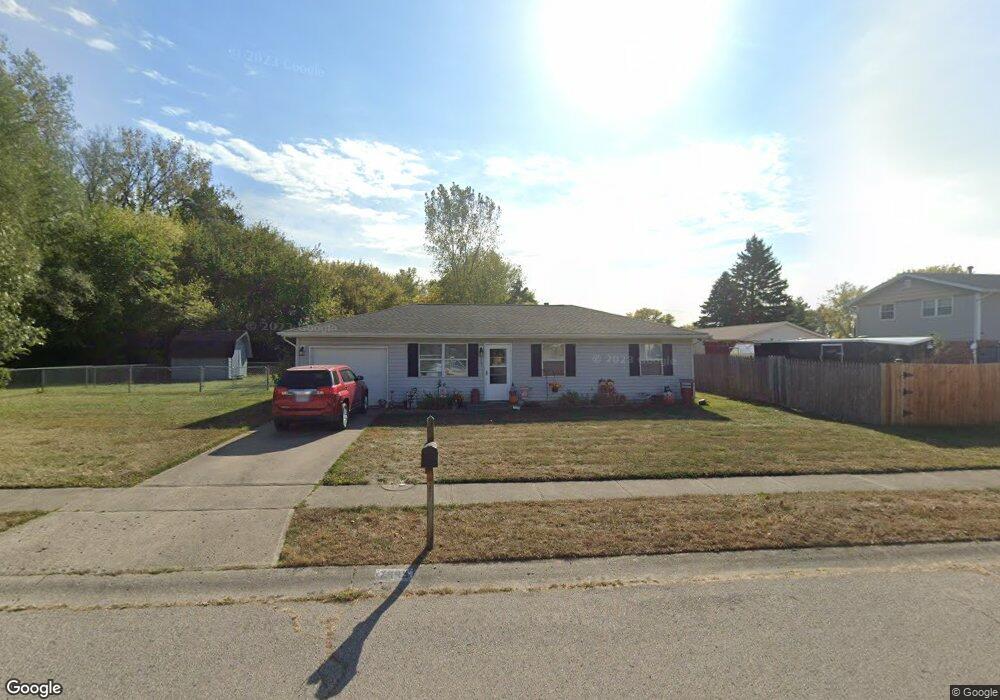
7995 Wescott Ave Fairborn, OH 45324
Estimated Value: $117,000 - $183,000
3
Beds
1
Bath
900
Sq Ft
$175/Sq Ft
Est. Value
About This Home
This home is located at 7995 Wescott Ave, Fairborn, OH 45324 and is currently estimated at $157,387, approximately $174 per square foot. 7995 Wescott Ave is a home located in Clark County with nearby schools including Greenon Elementary School, Greenon Jr. High School, and Greenon High School.
Ownership History
Date
Name
Owned For
Owner Type
Purchase Details
Closed on
Jun 9, 2021
Sold by
Schmieder Mark D and Schmieder Sara A
Bought by
Thom Wood Llc
Current Estimated Value
Purchase Details
Closed on
Feb 5, 2007
Sold by
Hud
Bought by
Schmieder Mark
Purchase Details
Closed on
Jul 28, 2006
Sold by
Brown Verbal W
Bought by
Hud
Purchase Details
Closed on
Dec 29, 2000
Sold by
Glendalee Davis and Glendalee Rusty
Bought by
Brown Verbal W
Home Financials for this Owner
Home Financials are based on the most recent Mortgage that was taken out on this home.
Original Mortgage
$84,816
Interest Rate
7.77%
Mortgage Type
FHA
Purchase Details
Closed on
Nov 8, 1995
Sold by
Schenck Jamie S
Bought by
Davis Glendalee
Home Financials for this Owner
Home Financials are based on the most recent Mortgage that was taken out on this home.
Original Mortgage
$69,900
Interest Rate
7.7%
Mortgage Type
Purchase Money Mortgage
Create a Home Valuation Report for This Property
The Home Valuation Report is an in-depth analysis detailing your home's value as well as a comparison with similar homes in the area
Home Values in the Area
Average Home Value in this Area
Purchase History
| Date | Buyer | Sale Price | Title Company |
|---|---|---|---|
| Thom Wood Llc | $70,000 | Eris Title Agency | |
| Schmieder Mark | $75,000 | Lakeside Title Agency | |
| Hud | $97,014 | None Available | |
| Brown Verbal W | $84,900 | -- | |
| Davis Glendalee | $69,900 | -- |
Source: Public Records
Mortgage History
| Date | Status | Borrower | Loan Amount |
|---|---|---|---|
| Previous Owner | Brown Verbal W | $84,816 | |
| Previous Owner | Davis Glendalee | $69,900 |
Source: Public Records
Tax History
| Year | Tax Paid | Tax Assessment Tax Assessment Total Assessment is a certain percentage of the fair market value that is determined by local assessors to be the total taxable value of land and additions on the property. | Land | Improvement |
|---|---|---|---|---|
| 2025 | $2,024 | $48,640 | $10,750 | $37,890 |
| 2024 | $1,977 | $37,000 | $9,330 | $27,670 |
| 2023 | $1,977 | $37,000 | $9,330 | $27,670 |
| 2022 | $1,975 | $37,000 | $9,330 | $27,670 |
| 2021 | $1,638 | $27,800 | $7,530 | $20,270 |
| 2020 | $1,642 | $27,800 | $7,530 | $20,270 |
| 2019 | $1,665 | $27,800 | $7,530 | $20,270 |
| 2018 | $1,647 | $26,890 | $7,530 | $19,360 |
| 2017 | $1,651 | $28,350 | $7,525 | $20,825 |
| 2016 | $1,438 | $28,350 | $7,525 | $20,825 |
| 2015 | $709 | $27,381 | $7,525 | $19,856 |
| 2014 | $1,422 | $27,381 | $7,525 | $19,856 |
| 2013 | $625 | $27,381 | $7,525 | $19,856 |
Source: Public Records
Map
Nearby Homes
- 5221 Ottawa Dr
- 6 Danzig Ln
- 0 Enon Xenia Rd
- 7850 Kings Ridge Cir
- 7050 Creekside Cir
- 0 Enon-Xenia Rd
- 2133 Willow Run Cir Unit 2133
- 5463 Enon-Xenia Rd
- 2151 Willow Run Cir Unit 2151
- 1798 Fawnwood Ct
- 1769 Fawnwood Ct
- 4600 Snider Rd
- 1830 Wildflower Rd
- 1873 Wildflower Rd
- 4538 Cynthia Dr
- 4024 Raymond Dr
- 4200 Phillips St
- 144 Matthews Ave
- 6250 Fairfield Pike
- 199 Fairfield Pike
- 8007 Philadelphia Dr
- 8015 Philadelphia Dr
- 5326 Saum St
- 8025 Philadelphia Dr
- 8008 Wescott Ave
- 5320 Saum St
- 8033 Philadelphia Dr
- 8014 Wescott Ave
- 8006 Philadelphia Dr
- 5347 Wakefield Dr
- 8014 Philadelphia Dr
- 5317 Saum St
- 5314 Saum St
- 8041 Philadelphia Dr
- 8022 Philadelphia Dr
- 8020 Wescott Ave
- 5341 Wakefield Dr
- 5309 Saum St
- 5306 Waverly St
- 5306 Saum St
Your Personal Tour Guide
Ask me questions while you tour the home.