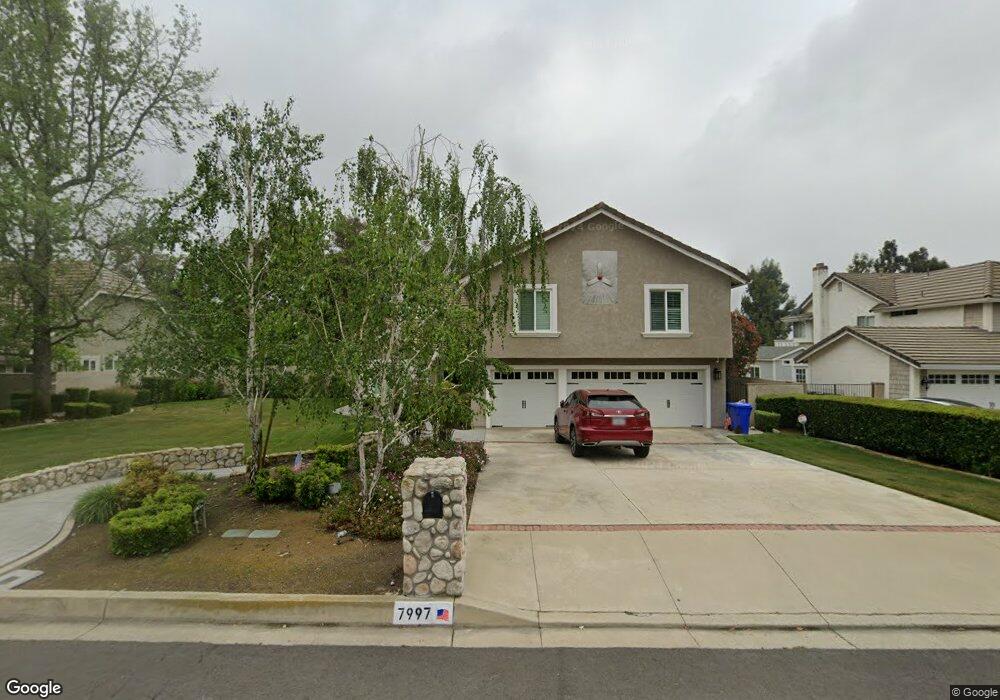
7997 Jennet St Rancho Cucamonga, CA 91701
Estimated Value: $1,101,000 - $1,452,000
4
Beds
3
Baths
2,551
Sq Ft
$485/Sq Ft
Est. Value
About This Home
This home is located at 7997 Jennet St, Rancho Cucamonga, CA 91701 and is currently estimated at $1,236,060, approximately $484 per square foot. 7997 Jennet St is a home located in San Bernardino County with nearby schools including Floyd M. Stork Elementary, Alta Loma Junior High, and Alta Loma High.
Ownership History
Date
Name
Owned For
Owner Type
Purchase Details
Closed on
Oct 6, 1994
Sold by
Segool Earl Kim
Bought by
Earl Kenneth W
Current Estimated Value
Purchase Details
Closed on
Jul 19, 1994
Sold by
California/Equicredit Corp
Bought by
Earl Kenneth Warren and Segool Earl Kim
Home Financials for this Owner
Home Financials are based on the most recent Mortgage that was taken out on this home.
Original Mortgage
$233,100
Interest Rate
4.5%
Purchase Details
Closed on
Feb 7, 1994
Sold by
Unitrusco Corp
Bought by
California Equicredit and Old Stone Credit Corp Of Ca
Create a Home Valuation Report for This Property
The Home Valuation Report is an in-depth analysis detailing your home's value as well as a comparison with similar homes in the area
Home Values in the Area
Average Home Value in this Area
Purchase History
| Date | Buyer | Sale Price | Title Company |
|---|---|---|---|
| Earl Kenneth W | -- | First American Title Ins Co | |
| Earl Kenneth Warren | $259,000 | First American Title Ins Co | |
| California Equicredit | $92,053 | World Title Company |
Source: Public Records
Mortgage History
| Date | Status | Borrower | Loan Amount |
|---|---|---|---|
| Closed | Earl Kenneth Warren | $233,100 |
Source: Public Records
Tax History Compared to Growth
Tax History
| Year | Tax Paid | Tax Assessment Tax Assessment Total Assessment is a certain percentage of the fair market value that is determined by local assessors to be the total taxable value of land and additions on the property. | Land | Improvement |
|---|---|---|---|---|
| 2025 | $4,789 | $448,710 | $149,495 | $299,215 |
| 2024 | $4,789 | $439,912 | $146,564 | $293,348 |
| 2023 | $4,680 | $431,286 | $143,690 | $287,596 |
| 2022 | $4,667 | $422,830 | $140,873 | $281,957 |
| 2021 | $4,664 | $414,539 | $138,111 | $276,428 |
| 2020 | $4,471 | $410,289 | $136,695 | $273,594 |
| 2019 | $4,521 | $402,244 | $134,015 | $268,229 |
| 2018 | $4,418 | $394,357 | $131,387 | $262,970 |
| 2017 | $4,138 | $379,615 | $128,809 | $250,806 |
| 2016 | $4,025 | $372,171 | $126,283 | $245,888 |
| 2015 | $3,998 | $366,581 | $124,386 | $242,195 |
| 2014 | $3,884 | $359,400 | $121,949 | $237,451 |
Source: Public Records
Map
Nearby Homes
- 7950 Gardenia Ave
- 5800 Ridgeway Rd
- 8010 Rosebud St
- 8291 Jennet St
- 8093 Banyan St
- 880 E 24th St
- 8309 Hillside Rd
- 6087 Aquamarine Ave
- 8288 Hillside Rd
- 2421 Cliff Rd
- 2479 Cliff Rd
- 641 Trail View Ct
- 6114 Sard St
- 6113 Sard St
- 5234 Della Ave
- 6073 Cameo St
- 2501 Cliff Rd
- 477 Paxton Ct
- 2464 Prospect Dr
- 8327 La Senda Rd
- 8001 Jennet St
- 7983 Jennet St
- 8009 Jennet St
- 7969 Jennet St
- 7994 Thoroughbred St
- 5753 Indigo Ave
- 8006 Thoroughbred St
- 7980 Thoroughbred St
- 5736 Fox Ct
- 8020 Thoroughbred St
- 7966 Thoroughbred St
- 8023 Jennet St
- 7955 Jennet St
- 5739 Indigo Ave
- 8034 Thoroughbred St
- 5722 Fox Ct
- 5752 Indigo Ave
- 8037 Jennet St
- 7954 Thoroughbred St
- 5727 Indigo Ave