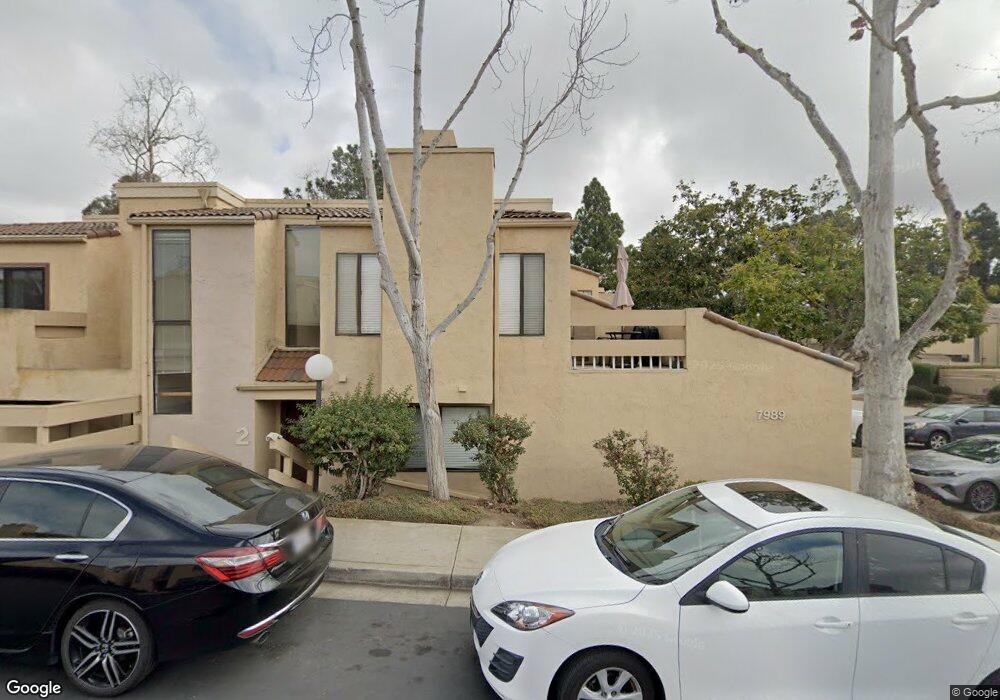
7999 Caminito Dia Unit 4 San Diego, CA 92122
University City NeighborhoodEstimated Value: $627,000 - $740,000
2
Beds
1
Bath
927
Sq Ft
$728/Sq Ft
Est. Value
About This Home
This home is located at 7999 Caminito Dia Unit 4, San Diego, CA 92122 and is currently estimated at $674,848, approximately $727 per square foot. 7999 Caminito Dia Unit 4 is a home located in San Diego County with nearby schools including Doyle Elementary School, Standley Middle School, and University City High School.
Ownership History
Date
Name
Owned For
Owner Type
Purchase Details
Closed on
May 25, 2020
Sold by
Yu Jonathan and Fruto Beverly
Bought by
Yu Jonathan H and Fruto Beverly R
Current Estimated Value
Purchase Details
Closed on
Nov 6, 2006
Sold by
Yu Jonathan
Bought by
Yu Jonathan and Fruto Beverly
Home Financials for this Owner
Home Financials are based on the most recent Mortgage that was taken out on this home.
Original Mortgage
$50,000
Outstanding Balance
$20,251
Interest Rate
6.28%
Mortgage Type
Stand Alone Refi Refinance Of Original Loan
Estimated Equity
$654,597
Purchase Details
Closed on
Apr 8, 2005
Sold by
Yu David U L and Yu Carolyn A
Bought by
Yu Jonathan
Home Financials for this Owner
Home Financials are based on the most recent Mortgage that was taken out on this home.
Original Mortgage
$220,000
Outstanding Balance
$114,192
Interest Rate
5.87%
Mortgage Type
Purchase Money Mortgage
Estimated Equity
$560,656
Purchase Details
Closed on
Oct 2, 1990
Purchase Details
Closed on
Jan 29, 1987
Create a Home Valuation Report for This Property
The Home Valuation Report is an in-depth analysis detailing your home's value as well as a comparison with similar homes in the area
Home Values in the Area
Average Home Value in this Area
Purchase History
| Date | Buyer | Sale Price | Title Company |
|---|---|---|---|
| Yu Jonathan H | -- | None Available | |
| Yu Jonathan | -- | Chicago Title Co | |
| Yu Jonathan | -- | Chicago Title Co | |
| Yu David U L | -- | Chicago Title Co | |
| Moutier Christine Yu | -- | Chicago Title Co | |
| -- | $140,500 | -- | |
| -- | $88,000 | -- |
Source: Public Records
Mortgage History
| Date | Status | Borrower | Loan Amount |
|---|---|---|---|
| Open | Yu Jonathan | $50,000 | |
| Open | Yu Jonathan | $220,000 | |
| Closed | Yu Jonathan | $55,000 |
Source: Public Records
Tax History Compared to Growth
Tax History
| Year | Tax Paid | Tax Assessment Tax Assessment Total Assessment is a certain percentage of the fair market value that is determined by local assessors to be the total taxable value of land and additions on the property. | Land | Improvement |
|---|---|---|---|---|
| 2025 | $3,903 | $321,556 | $211,661 | $109,895 |
| 2024 | $3,903 | $315,252 | $207,511 | $107,741 |
| 2023 | $3,817 | $309,072 | $203,443 | $105,629 |
| 2022 | $3,716 | $303,012 | $199,454 | $103,558 |
| 2021 | $3,691 | $297,072 | $195,544 | $101,528 |
| 2020 | $3,646 | $294,026 | $193,539 | $100,487 |
| 2019 | $3,582 | $288,262 | $189,745 | $98,517 |
| 2018 | $3,350 | $282,611 | $186,025 | $96,586 |
| 2017 | $81 | $277,071 | $182,378 | $94,693 |
| 2016 | $3,218 | $271,639 | $178,802 | $92,837 |
| 2015 | $3,171 | $267,560 | $176,117 | $91,443 |
| 2014 | $3,039 | $262,320 | $172,668 | $89,652 |
Source: Public Records
Map
Nearby Homes
- 7969 Caminito Dia Unit 3
- 4210 Porte de Palmas Unit 28
- 4145 Porte de Merano Unit 128
- 7825 Camino Tranquilo Unit 26
- 7837 Camino Tranquilo
- 3965 Camino Lindo Unit 194
- 3941 Camino Lindo
- 7975 Playmor Terrace
- 8308 Regents Rd Unit 1F
- 8308 Regents Rd Unit 1H
- 8338 Regents Rd Unit 1S
- 7565 Charmant Dr Unit 615
- 7565 Charmant Dr Unit 512
- 7597 Charmant Dr Unit 901
- 8328 Regents Rd Unit 1K
- 7849 Camino Glorita
- 7833 Camino Huerta
- 3967 Nobel Dr Unit 264
- 3979 Nobel Dr Unit 305
- 3941 Nobel Dr Unit 174
- 7904 Caminito Dia
- 7904 Caminito Dia Unit 4
- 7904 Caminito Dia Unit 1
- 7904 Caminito Dia Unit 2
- 7904 Caminito Dia Unit 3
- 7999 Caminito Dia Unit 2
- 7999 Caminito Dia Unit 1
- 7999 Caminito Dia Unit 3
- 0 Caminito Dia Unit 2
- 7954 Caminito Dia Unit 4
- 7954 Caminito Dia Unit 1
- 7954 Caminito Dia Unit 2
- 7954 Caminito Dia Unit 3
- 7959 Caminito Dia Unit 2
- 7959 Caminito Dia Unit 4
- 7959 Caminito Dia Unit 1
- 7959 Caminito Dia Unit 3
- 7944 Caminito Dia Unit 4
- 7944 Caminito Dia Unit 1
- 7944 Caminito Dia Unit 3