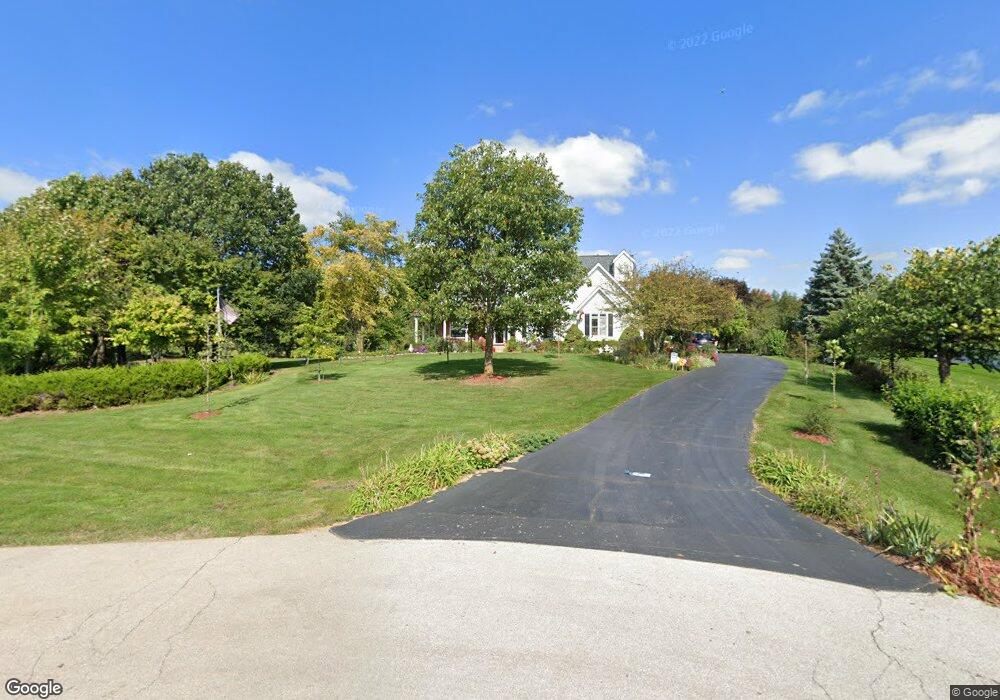
7N532 Foxglove Ct Unit 3A Saint Charles, IL 60175
Cranston Meadows Park NeighborhoodEstimated Value: $823,308 - $921,000
4
Beds
2
Baths
3,422
Sq Ft
$254/Sq Ft
Est. Value
About This Home
This home is located at 7N532 Foxglove Ct Unit 3A, Saint Charles, IL 60175 and is currently estimated at $869,577, approximately $254 per square foot. 7N532 Foxglove Ct Unit 3A is a home located in Kane County with nearby schools including Ferson Creek Elementary School, Thompson Middle School, and St Charles North High School.
Ownership History
Date
Name
Owned For
Owner Type
Purchase Details
Closed on
Dec 10, 2015
Sold by
Gorski John H and Gorski Mary E
Bought by
Gorski John H and Gorski Mary E
Current Estimated Value
Home Financials for this Owner
Home Financials are based on the most recent Mortgage that was taken out on this home.
Original Mortgage
$351,000
Outstanding Balance
$277,581
Interest Rate
3.87%
Mortgage Type
Adjustable Rate Mortgage/ARM
Estimated Equity
$591,996
Purchase Details
Closed on
Jun 22, 2000
Sold by
Mercier Kenneth and Mercier Karen E
Bought by
Gorski John H and Stull Gorski Mary E
Home Financials for this Owner
Home Financials are based on the most recent Mortgage that was taken out on this home.
Original Mortgage
$330,000
Interest Rate
8.64%
Purchase Details
Closed on
May 16, 1996
Sold by
Three Lakes Development Corp
Bought by
Mercier Kenneth and Mercier Karen E
Home Financials for this Owner
Home Financials are based on the most recent Mortgage that was taken out on this home.
Original Mortgage
$277,500
Interest Rate
8.1%
Create a Home Valuation Report for This Property
The Home Valuation Report is an in-depth analysis detailing your home's value as well as a comparison with similar homes in the area
Home Values in the Area
Average Home Value in this Area
Purchase History
| Date | Buyer | Sale Price | Title Company |
|---|---|---|---|
| Gorski John H | -- | Acquest Title Services Llc | |
| Gorski John H | $431,000 | Chicago Title Insurance Co | |
| Mercier Kenneth | $82,000 | Chicago Title Insurance Co |
Source: Public Records
Mortgage History
| Date | Status | Borrower | Loan Amount |
|---|---|---|---|
| Open | Gorski John H | $351,000 | |
| Closed | Gorski John H | $330,000 | |
| Previous Owner | Mercier Kenneth | $277,500 |
Source: Public Records
Tax History Compared to Growth
Tax History
| Year | Tax Paid | Tax Assessment Tax Assessment Total Assessment is a certain percentage of the fair market value that is determined by local assessors to be the total taxable value of land and additions on the property. | Land | Improvement |
|---|---|---|---|---|
| 2024 | $14,987 | $216,521 | $52,159 | $164,362 |
| 2023 | $14,275 | $193,789 | $46,683 | $147,106 |
| 2022 | $14,479 | $189,547 | $49,366 | $140,181 |
| 2021 | $14,308 | $180,676 | $47,056 | $133,620 |
| 2020 | $14,238 | $177,308 | $46,179 | $131,129 |
| 2019 | $14,010 | $173,798 | $45,265 | $128,533 |
| 2018 | $14,206 | $175,524 | $44,132 | $131,392 |
| 2017 | $13,546 | $169,523 | $42,623 | $126,900 |
| 2016 | $14,617 | $168,024 | $41,126 | $126,898 |
| 2015 | -- | $158,868 | $40,683 | $118,185 |
| 2014 | -- | $162,875 | $40,683 | $122,192 |
| 2013 | -- | $162,481 | $41,090 | $121,391 |
Source: Public Records
Map
Nearby Homes
- 7N919 Cloverfield Rd
- 761 Reserve Ct
- 7N949 Stevens Rd
- 791 Reserve Ct
- 1251 Lansbrook Dr
- 4 Persimmon Ln
- 552 Waters Edge Dr
- 675 Oak Ln
- 37W993 Heritage Oaks Dr
- 38W608 Sunvale Dr
- 2193 W Thornwood Dr
- 6N729 Old Homestead Rd
- 3547 Doral Dr
- 2550 Stony Ln
- 8N530 Gingerwood Ln
- 731 Lake Ridge Dr
- 8N465 Shady Ln
- 2159 Sutton Dr
- 3588 Sandstone Cir
- 3591 Sandstone Cir
- 7N514 Foxglove Ct
- 7N527 Foxglove Ct Unit 3A
- 7N633 Wagontire Rd
- 7N625 Wagontire Rd
- 7N494 Foxglove Ct Unit 3A
- 7N645 Wagontire Rd Unit 5
- 7N511 Foxglove Ct Unit 3A
- 7N605 Wagontire Rd
- 7N561 Wagontire Rd Unit 5
- 7N539 Wagontire Rd
- 7N655 Wagontire Rd
- 7N460 Foxglove Ct Unit 3A
- 7N459 Foxglove Ct
- 38W342 Stevens Glen Rd Unit 3A
- 7N642 Wagontire Rd
- 7N699 Wagontire Rd Unit 5
- 38W364 Stevens Glen Rd
- 7N469 Wagontire Rd
- 7N640 Wagontire Rd
- 7N577 Stevens Rd