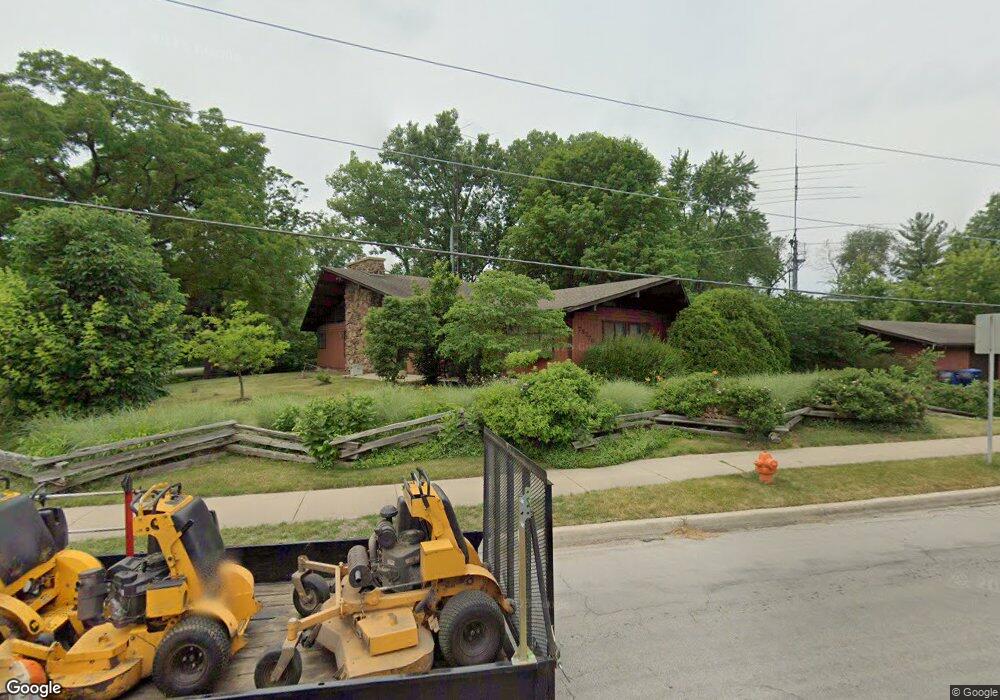
7S270 S Charles Ave Naperville, IL 60540
East Naperville NeighborhoodEstimated Value: $671,440 - $774,000
--
Bed
--
Bath
2,654
Sq Ft
$271/Sq Ft
Est. Value
About This Home
This home is located at 7S270 S Charles Ave, Naperville, IL 60540 and is currently estimated at $720,360, approximately $271 per square foot. 7S270 S Charles Ave is a home located in DuPage County with nearby schools including Prairie Elementary School, Admiral Byrd Elementary School, and Washington Jr High School.
Ownership History
Date
Name
Owned For
Owner Type
Purchase Details
Closed on
Aug 25, 2016
Sold by
Jackson Mei Hing and Mei Hing Jackson Living Trust
Bought by
Jackson Robert A and Jackson Mei Hing
Current Estimated Value
Purchase Details
Closed on
Aug 12, 2016
Sold by
Jackson Robert A and Jackson Mei Hing
Bought by
Jackson Robert A and Jackson Mei Hing
Purchase Details
Closed on
Dec 29, 2000
Sold by
Jackson Robert A and Jackson Mei Hing
Bought by
Jackson Mei Hing and Jackson Robert A
Create a Home Valuation Report for This Property
The Home Valuation Report is an in-depth analysis detailing your home's value as well as a comparison with similar homes in the area
Home Values in the Area
Average Home Value in this Area
Purchase History
| Date | Buyer | Sale Price | Title Company |
|---|---|---|---|
| Jackson Robert A | -- | Attorney | |
| Jackson Robert A | -- | Attorney | |
| Jackson Mei Hing | -- | -- |
Source: Public Records
Tax History Compared to Growth
Tax History
| Year | Tax Paid | Tax Assessment Tax Assessment Total Assessment is a certain percentage of the fair market value that is determined by local assessors to be the total taxable value of land and additions on the property. | Land | Improvement |
|---|---|---|---|---|
| 2024 | $11,174 | $207,624 | $83,821 | $123,803 |
| 2023 | $10,719 | $189,490 | $76,500 | $112,990 |
| 2022 | $10,208 | $172,270 | $69,550 | $102,720 |
| 2021 | $9,798 | $165,760 | $66,920 | $98,840 |
| 2020 | $9,576 | $162,780 | $65,720 | $97,060 |
| 2019 | $9,320 | $155,740 | $62,880 | $92,860 |
| 2018 | $8,971 | $149,750 | $60,460 | $89,290 |
| 2017 | $8,812 | $144,700 | $58,420 | $86,280 |
| 2016 | $8,627 | $139,470 | $56,310 | $83,160 |
| 2015 | $8,571 | $131,340 | $53,030 | $78,310 |
| 2014 | $7,802 | $117,270 | $47,350 | $69,920 |
| 2013 | $7,698 | $117,550 | $47,460 | $70,090 |
Source: Public Records
Map
Nearby Homes
- 625 Edward Rd
- 820 Prairie Ave
- 923 Tim Tam Cir
- 488 S Columbia St
- 1300 Old Dominion Rd
- 907 Secretariat Dr
- 440 S Columbia St
- 908 Julian Ct
- 616 Driftwood Ct
- 444 S Sleight St
- 1133 Catherine Ave
- 821 Wellner Rd
- 915 E Chicago Ave
- 706 S Loomis St Unit D
- 1105 Johnson Dr
- 203 S Columbia St
- 325 Pine Ct
- 328 S Loomis St
- 1386 Old Dominion Ct
- 116 S Wright St
- 26W028 Parkside Rd
- 26W028 Parkside Rd
- 2 Parkside Rd
- 1081 Parkside Rd
- 646 S Charles Ave
- 1070 E Hillside Rd
- 1050 E Hillside Rd
- 26W021 Parkside Rd
- 650 S Charles Ave
- 7S241 S Charles Ave
- 600 Balmoral Cir
- 1071 Parkside Rd
- 605 Balmoral Cir
- 1040 E Hillside Rd
- 1061 Parkside Rd
- 624 S Charles Ave Unit A
- 624 S Charles Ave Unit B
- 624 S Charles Ave Unit D
- 624 S Charles Ave Unit C
- 609 Balmoral Cir