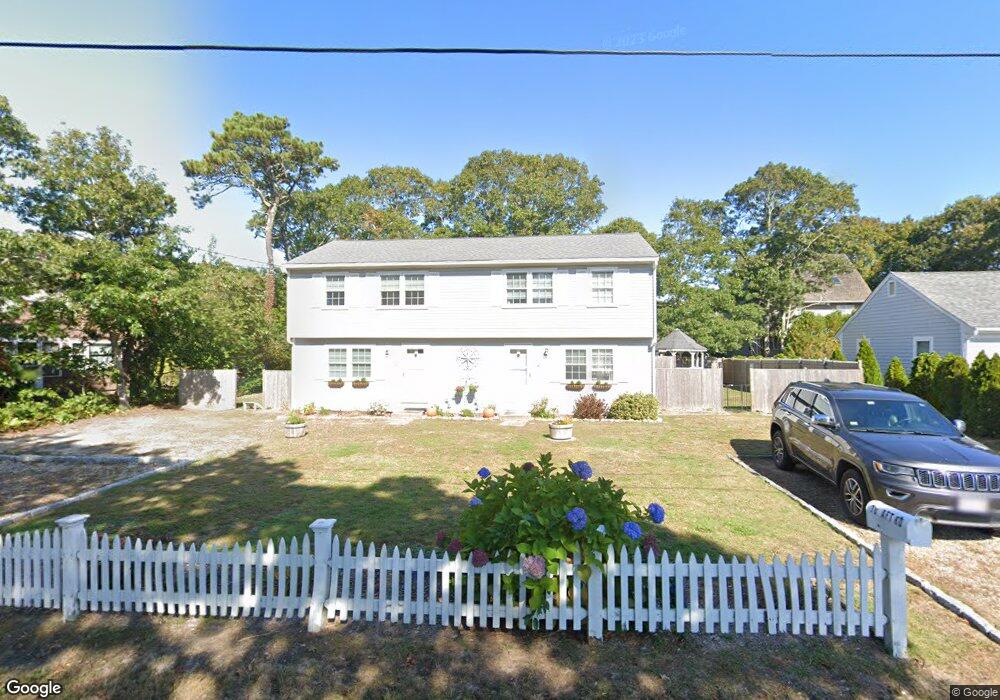
8 Aft Rd Unit 8-10 South Yarmouth, MA 02664
Estimated Value: $762,000 - $864,661
6
Beds
2
Baths
2,016
Sq Ft
$404/Sq Ft
Est. Value
About This Home
This home is located at 8 Aft Rd Unit 8-10, South Yarmouth, MA 02664 and is currently estimated at $814,415, approximately $403 per square foot. 8 Aft Rd Unit 8-10 is a home located in Barnstable County with nearby schools including Dennis-Yarmouth Regional High School and St. Pius X. School.
Ownership History
Date
Name
Owned For
Owner Type
Purchase Details
Closed on
May 13, 2016
Sold by
Ricardi Philip A and Ricardi Jane E
Bought by
Campbell Linda A
Current Estimated Value
Purchase Details
Closed on
Feb 1, 2000
Sold by
Kapsalopoulou Ariadni
Bought by
Ricardi Philip A and Ricardi Jane E
Home Financials for this Owner
Home Financials are based on the most recent Mortgage that was taken out on this home.
Original Mortgage
$175,050
Interest Rate
7.83%
Mortgage Type
Purchase Money Mortgage
Create a Home Valuation Report for This Property
The Home Valuation Report is an in-depth analysis detailing your home's value as well as a comparison with similar homes in the area
Home Values in the Area
Average Home Value in this Area
Purchase History
| Date | Buyer | Sale Price | Title Company |
|---|---|---|---|
| Campbell Linda A | $390,000 | -- | |
| Ricardi Philip A | $194,500 | -- |
Source: Public Records
Mortgage History
| Date | Status | Borrower | Loan Amount |
|---|---|---|---|
| Previous Owner | Ricardi Philip A | $175,050 |
Source: Public Records
Tax History Compared to Growth
Tax History
| Year | Tax Paid | Tax Assessment Tax Assessment Total Assessment is a certain percentage of the fair market value that is determined by local assessors to be the total taxable value of land and additions on the property. | Land | Improvement |
|---|---|---|---|---|
| 2025 | $5,029 | $710,300 | $436,600 | $273,700 |
| 2024 | $4,737 | $641,900 | $379,700 | $262,200 |
| 2023 | $4,547 | $560,700 | $309,900 | $250,800 |
| 2022 | $4,601 | $501,200 | $278,400 | $222,800 |
| 2021 | $4,229 | $442,400 | $261,600 | $180,800 |
| 2020 | $3,985 | $398,500 | $249,900 | $148,600 |
| 2019 | $3,883 | $384,500 | $249,900 | $134,600 |
| 2018 | $3,828 | $372,000 | $237,400 | $134,600 |
| 2017 | $3,602 | $359,500 | $237,400 | $122,100 |
| 2016 | $3,588 | $359,500 | $237,400 | $122,100 |
| 2015 | $3,609 | $359,500 | $237,400 | $122,100 |
Source: Public Records
Map
Nearby Homes