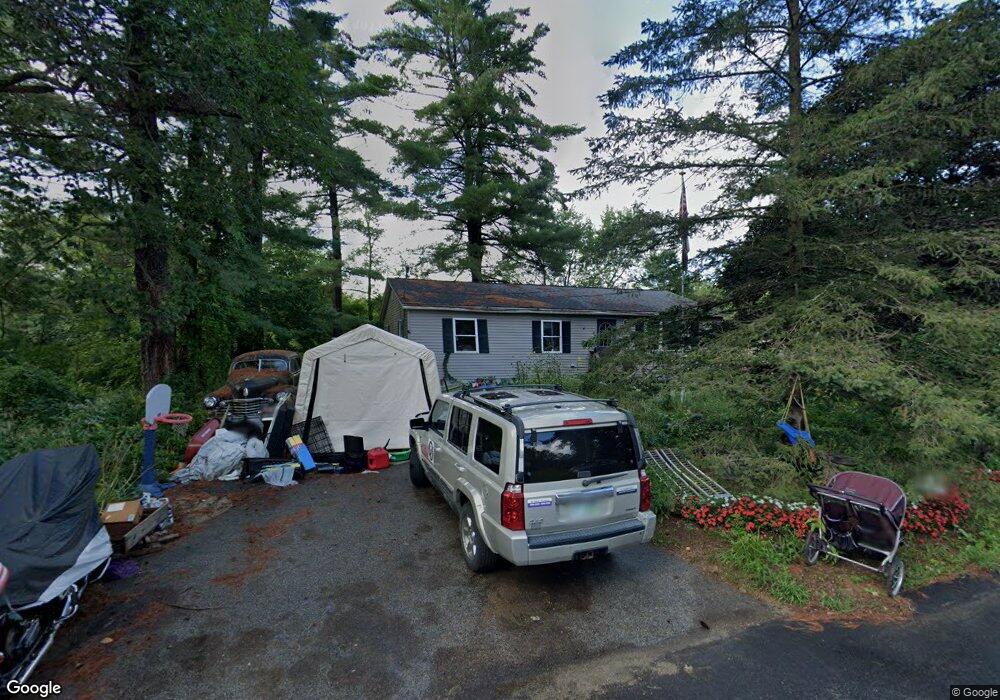
8 Albin Ave Allenstown, NH 03275
Estimated Value: $369,000 - $423,260
3
Beds
1
Bath
1,472
Sq Ft
$271/Sq Ft
Est. Value
About This Home
This home is located at 8 Albin Ave, Allenstown, NH 03275 and is currently estimated at $399,065, approximately $271 per square foot. 8 Albin Ave is a home located in Merrimack County with nearby schools including Allenstown Elementary School, Armand R. Dupont School, and Tender Years Child Care & Learning Center.
Ownership History
Date
Name
Owned For
Owner Type
Purchase Details
Closed on
Apr 8, 2010
Sold by
Carter Lloyd P
Bought by
Gamelin Patricia
Current Estimated Value
Home Financials for this Owner
Home Financials are based on the most recent Mortgage that was taken out on this home.
Original Mortgage
$148,500
Outstanding Balance
$99,492
Interest Rate
5.12%
Mortgage Type
Purchase Money Mortgage
Estimated Equity
$299,573
Create a Home Valuation Report for This Property
The Home Valuation Report is an in-depth analysis detailing your home's value as well as a comparison with similar homes in the area
Home Values in the Area
Average Home Value in this Area
Purchase History
| Date | Buyer | Sale Price | Title Company |
|---|---|---|---|
| Gamelin Patricia | $148,500 | -- |
Source: Public Records
Mortgage History
| Date | Status | Borrower | Loan Amount |
|---|---|---|---|
| Open | Gamelin Patricia | $148,500 |
Source: Public Records
Tax History Compared to Growth
Tax History
| Year | Tax Paid | Tax Assessment Tax Assessment Total Assessment is a certain percentage of the fair market value that is determined by local assessors to be the total taxable value of land and additions on the property. | Land | Improvement |
|---|---|---|---|---|
| 2024 | $7,936 | $312,200 | $136,900 | $175,300 |
| 2023 | $6,619 | $312,200 | $136,900 | $175,300 |
| 2022 | $6,088 | $312,200 | $136,900 | $175,300 |
| 2021 | $5,793 | $183,900 | $79,600 | $104,300 |
| 2020 | $5,388 | $183,900 | $79,600 | $104,300 |
| 2019 | $5,719 | $183,900 | $79,600 | $104,300 |
| 2018 | $5,545 | $183,900 | $79,600 | $104,300 |
| 2017 | $5,905 | $183,900 | $79,600 | $104,300 |
| 2016 | $5,164 | $152,500 | $57,400 | $95,100 |
| 2015 | $4,938 | $150,400 | $57,400 | $93,000 |
| 2014 | $5,081 | $150,400 | $57,400 | $93,000 |
| 2013 | $4,742 | $150,400 | $57,400 | $93,000 |
Source: Public Records
Map
Nearby Homes
- 9 Pine Acres Rd
- 307 Dearborn Rd
- 101 4th Range Rd Unit 4
- 5 Catamount Hill Dr
- 1 Jefferson Ave
- 11 Presidential Dr
- 6 Jackson Ave
- 233 Pembroke St
- 8 Bush Ave
- 43 Catamount Hill Dr
- 1 1/2 Bartlett St
- 111 Glass St
- 259 Pembroke St
- 12-14 Church St Unit 12,14
- 19 Sullivan Dr
- 10 Lane Dr
- 2 Cheryl Dr
- 100 Main St Unit M10
- 100 Main St Unit 204
- 422 Dawn Dr Unit 23