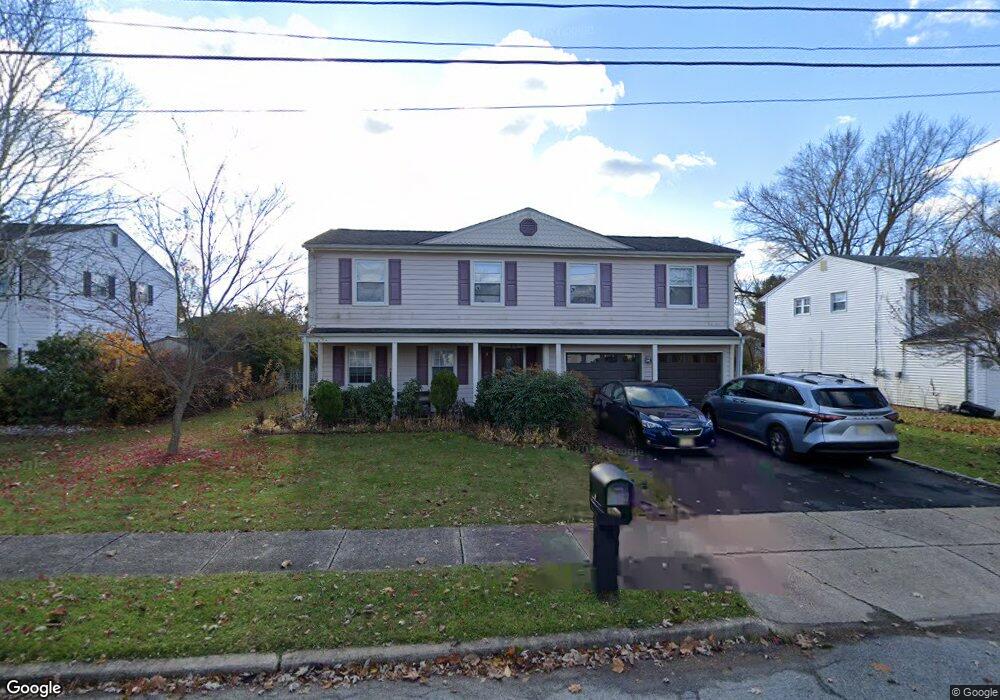
8 Apollo Way Flanders, NJ 07836
Estimated Value: $511,697 - $616,000
Studio
--
Bath
2,074
Sq Ft
$273/Sq Ft
Est. Value
About This Home
This home is located at 8 Apollo Way, Flanders, NJ 07836 and is currently estimated at $565,174, approximately $272 per square foot. 8 Apollo Way is a home located in Morris County with nearby schools including Mt Olive Middle School, Mount Olive High School, and American Christian School.
Ownership History
Date
Name
Owned For
Owner Type
Purchase Details
Closed on
May 28, 1999
Sold by
Collins Mary Ann
Bought by
Huang Karl and Huang Jennie
Current Estimated Value
Home Financials for this Owner
Home Financials are based on the most recent Mortgage that was taken out on this home.
Original Mortgage
$148,500
Outstanding Balance
$39,293
Interest Rate
7.09%
Mortgage Type
Purchase Money Mortgage
Estimated Equity
$525,881
Purchase Details
Closed on
Aug 25, 1995
Sold by
Collins Henry F
Bought by
Collins Mary Ann
Create a Home Valuation Report for This Property
The Home Valuation Report is an in-depth analysis detailing your home's value as well as a comparison with similar homes in the area
Home Values in the Area
Average Home Value in this Area
Purchase History
| Date | Buyer | Sale Price | Title Company |
|---|---|---|---|
| Huang Karl | $198,000 | First American | |
| Collins Mary Ann | -- | -- |
Source: Public Records
Mortgage History
| Date | Status | Borrower | Loan Amount |
|---|---|---|---|
| Open | Huang Karl | $148,500 |
Source: Public Records
Tax History
| Year | Tax Paid | Tax Assessment Tax Assessment Total Assessment is a certain percentage of the fair market value that is determined by local assessors to be the total taxable value of land and additions on the property. | Land | Improvement |
|---|---|---|---|---|
| 2025 | $10,884 | $312,300 | $172,700 | $139,600 |
| 2024 | $10,265 | $312,300 | $172,700 | $139,600 |
Source: Public Records
Map
Nearby Homes
- 12 Beecher Ln
- 4 Virgil Ln
- 95 Crenshaw Dr
- 1 Renault Dr
- 11 Renault Dr
- 7 Overbrook Rd
- 50 Main St
- 138 Bartley Flanders Rd
- 10 Clark Ln
- 4 Mill Rd
- 50 Clover Hill Dr
- 44 Deer Path Dr
- 36 Deer Path Dr
- 11 Grover St
- 5 Downstream Dr
- 6 Prides Crossing
- 15 Tinc Rd
- 209 Pleasant Hill Rd
- 150 U S Highway 206
- 4 Victoria Dr
Your Personal Tour Guide
Ask me questions while you tour the home.