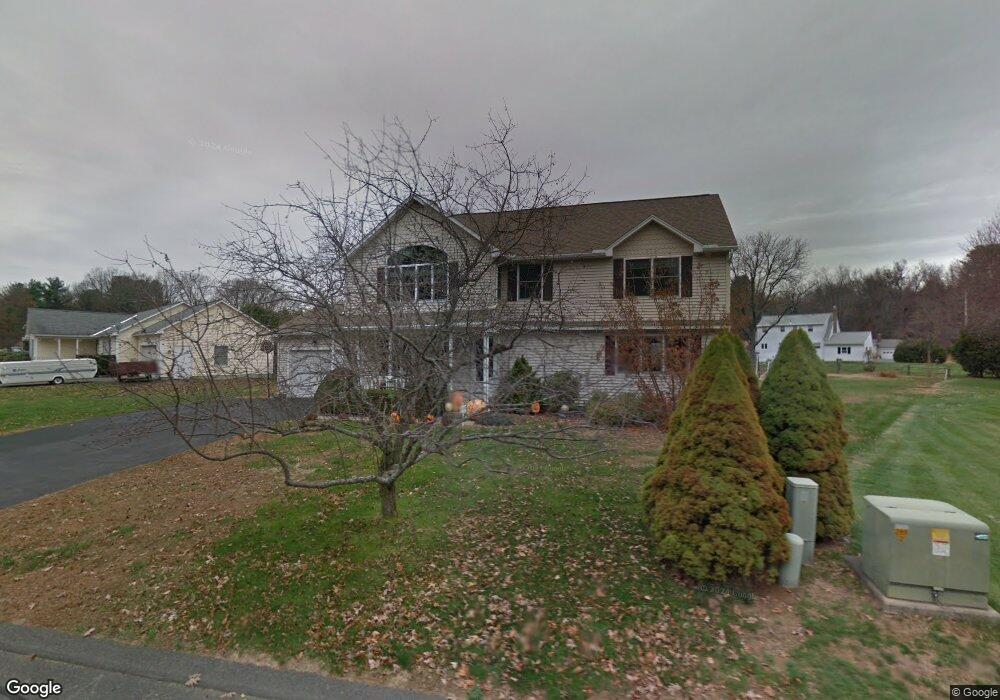
8 Apple Tree Ln Easthampton, MA 01027
Estimated Value: $453,000 - $667,000
3
Beds
3
Baths
2,676
Sq Ft
$217/Sq Ft
Est. Value
About This Home
This home is located at 8 Apple Tree Ln, Easthampton, MA 01027 and is currently estimated at $580,922, approximately $217 per square foot. 8 Apple Tree Ln is a home located in Hampshire County with nearby schools including Easthampton High School, Tri-County Schools, and New England Adolescent Research Institute.
Ownership History
Date
Name
Owned For
Owner Type
Purchase Details
Closed on
Nov 20, 1998
Sold by
Gehm Doris R and Gehm Raymond F
Bought by
Porter Scott L and Porter Sharon M
Current Estimated Value
Home Financials for this Owner
Home Financials are based on the most recent Mortgage that was taken out on this home.
Original Mortgage
$106,000
Interest Rate
6.49%
Mortgage Type
Purchase Money Mortgage
Purchase Details
Closed on
Aug 30, 1993
Sold by
Elmwood Rt
Bought by
Gehm Raymond F and Gehm Doris R
Create a Home Valuation Report for This Property
The Home Valuation Report is an in-depth analysis detailing your home's value as well as a comparison with similar homes in the area
Home Values in the Area
Average Home Value in this Area
Purchase History
| Date | Buyer | Sale Price | Title Company |
|---|---|---|---|
| Porter Scott L | $132,500 | -- | |
| Gehm Raymond F | $127,500 | -- |
Source: Public Records
Mortgage History
| Date | Status | Borrower | Loan Amount |
|---|---|---|---|
| Open | Gehm Raymond F | $253,000 | |
| Closed | Gehm Raymond F | $106,000 |
Source: Public Records
Tax History
| Year | Tax Paid | Tax Assessment Tax Assessment Total Assessment is a certain percentage of the fair market value that is determined by local assessors to be the total taxable value of land and additions on the property. | Land | Improvement |
|---|---|---|---|---|
| 2025 | $7,483 | $547,400 | $122,800 | $424,600 |
| 2024 | $7,213 | $531,900 | $119,200 | $412,700 |
| 2023 | $5,344 | $364,800 | $94,400 | $270,400 |
| 2022 | $6,030 | $364,800 | $94,400 | $270,400 |
| 2021 | $6,660 | $379,700 | $94,400 | $285,300 |
| 2020 | $6,479 | $364,800 | $94,400 | $270,400 |
| 2019 | $5,324 | $344,400 | $94,400 | $250,000 |
| 2018 | $5,328 | $333,000 | $89,300 | $243,700 |
| 2017 | $5,195 | $320,500 | $85,600 | $234,900 |
| 2016 | $4,997 | $320,500 | $85,600 | $234,900 |
| 2015 | $4,856 | $320,500 | $85,600 | $234,900 |
Source: Public Records
Map
Nearby Homes
Your Personal Tour Guide
Ask me questions while you tour the home.