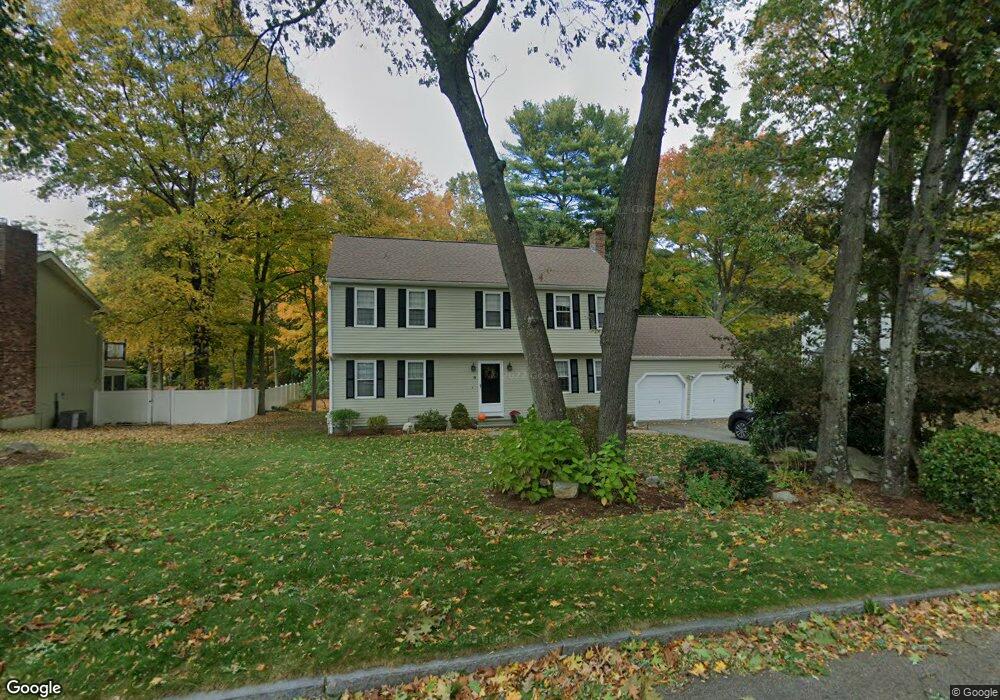
8 Arnold Rd Framingham, MA 01701
Estimated Value: $797,000 - $903,000
4
Beds
3
Baths
2,520
Sq Ft
$330/Sq Ft
Est. Value
About This Home
This home is located at 8 Arnold Rd, Framingham, MA 01701 and is currently estimated at $830,860, approximately $329 per square foot. 8 Arnold Rd is a home located in Middlesex County with nearby schools including Framingham High School, Summit Montessori School, and Saint Bridget School.
Ownership History
Date
Name
Owned For
Owner Type
Purchase Details
Closed on
Apr 3, 2013
Sold by
Hinkle Jeffrey G
Bought by
Hinkle Jeffrey G and Hinkle Claudia
Current Estimated Value
Home Financials for this Owner
Home Financials are based on the most recent Mortgage that was taken out on this home.
Original Mortgage
$380,000
Outstanding Balance
$78,274
Interest Rate
3.58%
Mortgage Type
New Conventional
Estimated Equity
$752,586
Purchase Details
Closed on
Sep 2, 2009
Sold by
Ng Cathy and Yee Gin
Bought by
Hinkle Jeffrey
Purchase Details
Closed on
Dec 10, 2004
Sold by
Hakami Malekeh
Bought by
Ng Cathy and Yee Gin
Purchase Details
Closed on
Feb 15, 1989
Sold by
Tenglund Gerald
Bought by
Hakami Malekeh
Create a Home Valuation Report for This Property
The Home Valuation Report is an in-depth analysis detailing your home's value as well as a comparison with similar homes in the area
Home Values in the Area
Average Home Value in this Area
Purchase History
| Date | Buyer | Sale Price | Title Company |
|---|---|---|---|
| Hinkle Jeffrey G | -- | -- | |
| Hinkle Jeffrey G | -- | -- | |
| Hinkle Jeffrey G | -- | -- | |
| Hinkle Jeffrey | $415,000 | -- | |
| Hinkle Jeffrey | $415,000 | -- | |
| Ng Cathy | $510,000 | -- | |
| Ng Cathy | $510,000 | -- | |
| Hakami Malekeh | $242,500 | -- | |
| Hakami Malekeh | $242,500 | -- |
Source: Public Records
Mortgage History
| Date | Status | Borrower | Loan Amount |
|---|---|---|---|
| Open | Hinkle Jeffrey G | $380,000 | |
| Closed | Hakami Malekeh | $380,000 |
Source: Public Records
Tax History Compared to Growth
Tax History
| Year | Tax Paid | Tax Assessment Tax Assessment Total Assessment is a certain percentage of the fair market value that is determined by local assessors to be the total taxable value of land and additions on the property. | Land | Improvement |
|---|---|---|---|---|
| 2025 | $9,331 | $781,500 | $289,500 | $492,000 |
| 2024 | $9,370 | $752,000 | $258,100 | $493,900 |
| 2023 | $8,872 | $677,800 | $230,300 | $447,500 |
| 2022 | $8,434 | $613,800 | $209,300 | $404,500 |
| 2021 | $8,233 | $586,000 | $201,200 | $384,800 |
| 2020 | $8,345 | $557,100 | $183,100 | $374,000 |
| 2019 | $8,299 | $539,600 | $183,100 | $356,500 |
| 2018 | $8,408 | $515,200 | $179,500 | $335,700 |
| 2017 | $8,044 | $481,400 | $161,300 | $320,100 |
| 2016 | $8,054 | $463,400 | $161,300 | $302,100 |
| 2015 | $8,049 | $451,700 | $176,200 | $275,500 |
Source: Public Records
Map
Nearby Homes
- 1186 Worcester Rd Unit 610
- 21 Knight Rd
- 337 Edgell Rd
- 1321 Worcester Rd Unit 603
- 85 Barber Rd
- 30 Elda Rd
- 484 Edgell Rd
- 63 Kellogg St
- 7 Gibbs Valley Path
- 574 Grove St
- 575 Union Ave Unit 1
- 102 Spruce St
- 450 Mount Wayte Ave
- 67 Long Ave
- 1500 Worcester Rd Unit 221
- 1500 Worcester Rd Unit 217
- 32 Lyman Rd
- 1 Vaillencourt Dr
- 1550 Worcester Rd Unit 101
- 2 Canterbury Place