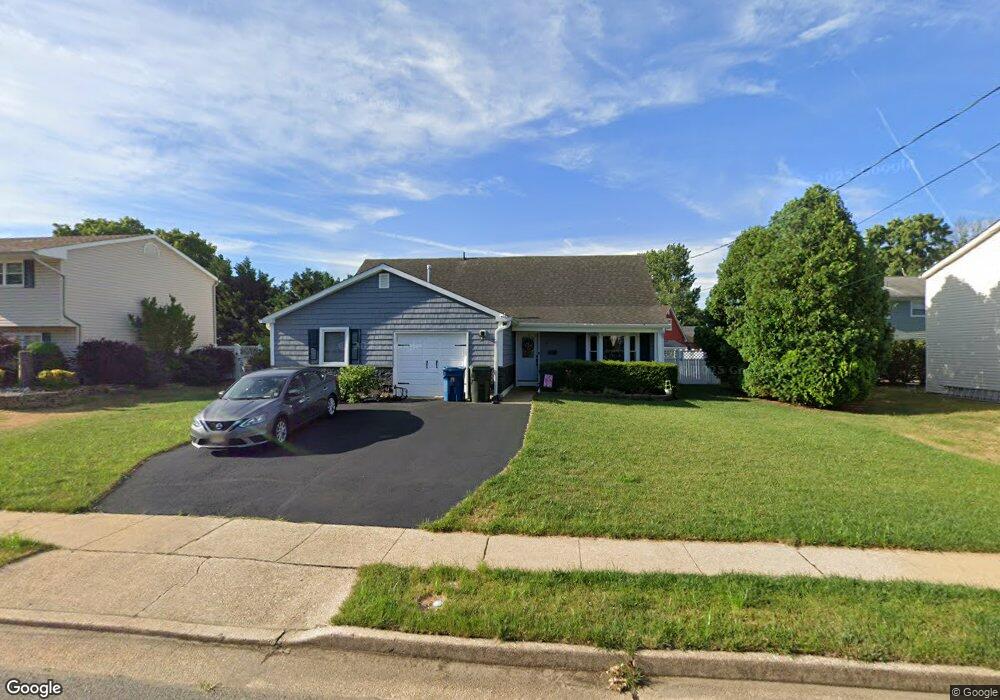
8 Belfast Ave Hazlet, NJ 07730
Estimated Value: $615,220 - $663,000
3
Beds
3
Baths
1,617
Sq Ft
$396/Sq Ft
Est. Value
About This Home
This home is located at 8 Belfast Ave, Hazlet, NJ 07730 and is currently estimated at $640,055, approximately $395 per square foot. 8 Belfast Ave is a home located in Monmouth County with nearby schools including Raritan High School, St Benedict School, and St. Joseph Elementary School.
Ownership History
Date
Name
Owned For
Owner Type
Purchase Details
Closed on
Apr 12, 2011
Sold by
Cherry Frank J
Bought by
Tressler Ryan and Little Bethany
Current Estimated Value
Home Financials for this Owner
Home Financials are based on the most recent Mortgage that was taken out on this home.
Original Mortgage
$285,000
Outstanding Balance
$197,541
Interest Rate
4.9%
Mortgage Type
New Conventional
Estimated Equity
$442,514
Create a Home Valuation Report for This Property
The Home Valuation Report is an in-depth analysis detailing your home's value as well as a comparison with similar homes in the area
Home Values in the Area
Average Home Value in this Area
Purchase History
| Date | Buyer | Sale Price | Title Company |
|---|---|---|---|
| Tressler Ryan | $305,000 | Title Resources Guaranty Co |
Source: Public Records
Mortgage History
| Date | Status | Borrower | Loan Amount |
|---|---|---|---|
| Open | Tressler Ryan | $285,000 |
Source: Public Records
Tax History Compared to Growth
Tax History
| Year | Tax Paid | Tax Assessment Tax Assessment Total Assessment is a certain percentage of the fair market value that is determined by local assessors to be the total taxable value of land and additions on the property. | Land | Improvement |
|---|---|---|---|---|
| 2025 | $10,452 | $559,800 | $375,000 | $184,800 |
| 2024 | $10,095 | $497,000 | $313,000 | $184,000 |
| 2023 | $10,095 | $472,400 | $290,000 | $182,400 |
| 2022 | $9,591 | $401,400 | $225,000 | $176,400 |
| 2021 | $9,591 | $373,900 | $217,000 | $156,900 |
| 2020 | $9,409 | $364,400 | $211,000 | $153,400 |
| 2019 | $9,115 | $347,500 | $195,000 | $152,500 |
| 2018 | $8,924 | $337,400 | $192,000 | $145,400 |
| 2017 | $8,438 | $319,000 | $187,000 | $132,000 |
| 2016 | $8,319 | $315,700 | $187,000 | $128,700 |
| 2015 | $8,184 | $311,400 | $186,000 | $125,400 |
| 2014 | $7,834 | $279,600 | $160,000 | $119,600 |
Source: Public Records
Map
Nearby Homes
- 9 Tralee Rd
- 570 Line Rd
- 30 Briscoe Terrace
- 101 Cresci Blvd
- 2 Avondale Ln
- 3 Avondale Ln
- 70 Northland Ln
- 40 North Cir
- 10 Deer St
- 46 Parkview Dr
- 672 N Beers St
- 627 Beers St
- 13 Ivy Hill Dr
- 7 Kaylen Place
- 160 Village Green Way
- 16 Moak Dr
- 557 Lloyd Rd Unit B
- 111 Courtland Ln
- 7 Lucia Ct Unit 7
- 32 Lake Blvd