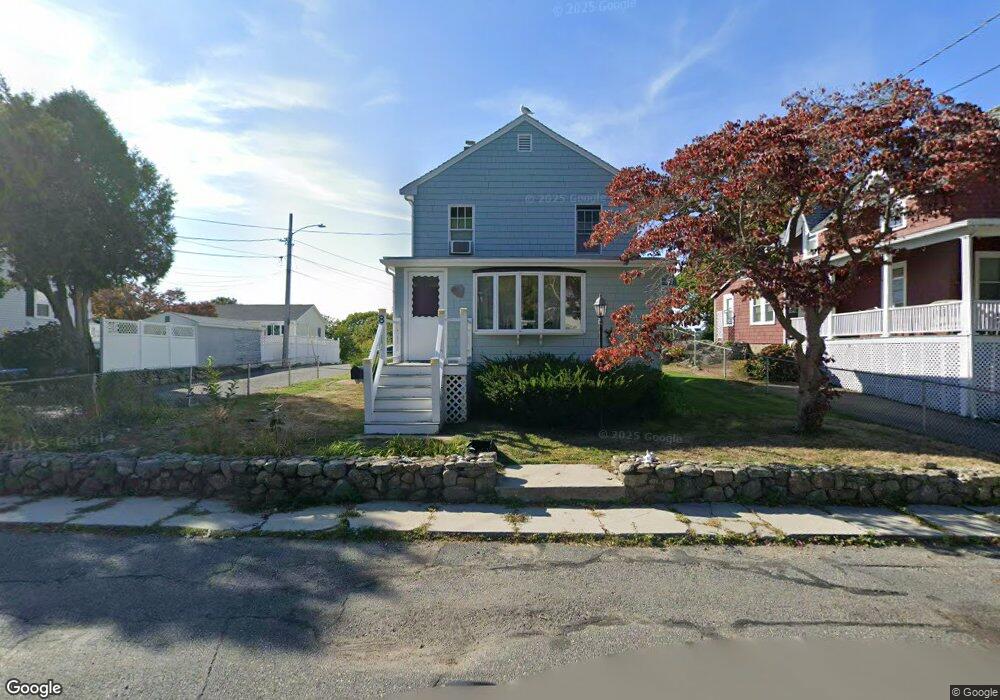
8 Blake Ct Gloucester, MA 01930
East Gloucester NeighborhoodEstimated Value: $566,176 - $776,000
2
Beds
1
Bath
1,108
Sq Ft
$631/Sq Ft
Est. Value
About This Home
This home is located at 8 Blake Ct, Gloucester, MA 01930 and is currently estimated at $699,544, approximately $631 per square foot. 8 Blake Ct is a home located in Essex County with nearby schools including East Gloucester Elementary School, Ralph B O'maley Middle School, and Gloucester High School.
Ownership History
Date
Name
Owned For
Owner Type
Purchase Details
Closed on
Jan 29, 2010
Sold by
Gerring Ronald J and Gerring Gail P
Bought by
Graham John and Siswick Rebecca
Current Estimated Value
Home Financials for this Owner
Home Financials are based on the most recent Mortgage that was taken out on this home.
Original Mortgage
$265,780
Interest Rate
4.95%
Mortgage Type
Purchase Money Mortgage
Create a Home Valuation Report for This Property
The Home Valuation Report is an in-depth analysis detailing your home's value as well as a comparison with similar homes in the area
Home Values in the Area
Average Home Value in this Area
Purchase History
| Date | Buyer | Sale Price | Title Company |
|---|---|---|---|
| Graham John | $274,000 | -- |
Source: Public Records
Mortgage History
| Date | Status | Borrower | Loan Amount |
|---|---|---|---|
| Open | Graham John | $254,700 | |
| Closed | Graham John | $265,780 | |
| Previous Owner | Graham John | $125,000 | |
| Previous Owner | Graham John | $50,000 |
Source: Public Records
Tax History
| Year | Tax Paid | Tax Assessment Tax Assessment Total Assessment is a certain percentage of the fair market value that is determined by local assessors to be the total taxable value of land and additions on the property. | Land | Improvement |
|---|---|---|---|---|
| 2025 | $4,677 | $481,200 | $199,700 | $281,500 |
| 2024 | $4,590 | $471,700 | $190,200 | $281,500 |
| 2023 | $4,398 | $415,300 | $169,800 | $245,500 |
| 2022 | $4,212 | $359,100 | $144,400 | $214,700 |
| 2021 | $4,059 | $326,300 | $131,200 | $195,100 |
| 2020 | $3,973 | $322,200 | $131,200 | $191,000 |
| 2019 | $3,779 | $297,800 | $131,200 | $166,600 |
| 2018 | $3,628 | $280,600 | $131,200 | $149,400 |
| 2017 | $3,516 | $266,600 | $125,000 | $141,600 |
| 2016 | $3,393 | $249,300 | $125,400 | $123,900 |
| 2015 | $3,271 | $239,600 | $125,400 | $114,200 |
Source: Public Records
Map
Nearby Homes
- 3 Mondello Square
- 11 Wall St Unit R
- 70 Bass Ave
- 36 Eastern Ave
- 197 E Main St Unit 1
- 26 Marina Dr
- 14R Spring St Unit 3
- 21 Marble Rd
- 23 Mount Vernon St
- 60 Rocky Neck Ave Unit 202
- 73 Rocky Neck Ave Unit 2
- 191 Main St Unit 3
- 191 Main St Unit 2A
- 50 Warner St
- 1 Wonson St
- 10 Seaview Rd
- 113 Pleasant St
- 40 Sargent St
- 33 Maplewood Ave Unit 310
- 28 Eastern Point Rd
Your Personal Tour Guide
Ask me questions while you tour the home.