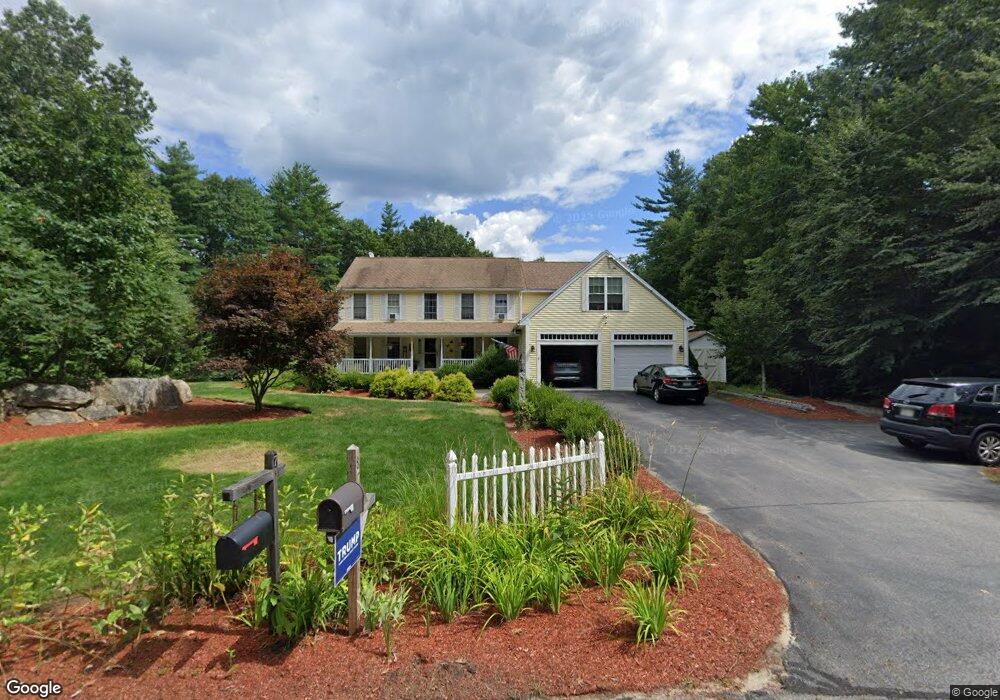
8 Blake Rd Raymond, NH 03077
Estimated Value: $632,000 - $762,000
3
Beds
3
Baths
3,149
Sq Ft
$227/Sq Ft
Est. Value
About This Home
This home is located at 8 Blake Rd, Raymond, NH 03077 and is currently estimated at $714,701, approximately $226 per square foot. 8 Blake Rd is a home located in Rockingham County with nearby schools including Lamprey River Elementary School, Iber Holmes Gove Middle School, and Raymond High School.
Ownership History
Date
Name
Owned For
Owner Type
Purchase Details
Closed on
Aug 19, 2013
Sold by
Potter Steven J and Fazio Cori
Bought by
Potter Steven J
Current Estimated Value
Home Financials for this Owner
Home Financials are based on the most recent Mortgage that was taken out on this home.
Original Mortgage
$203,700
Outstanding Balance
$150,064
Interest Rate
4.31%
Mortgage Type
Purchase Money Mortgage
Estimated Equity
$564,637
Purchase Details
Closed on
Mar 1, 2000
Sold by
Bimini Dev Corp
Bought by
Potter Steven J
Home Financials for this Owner
Home Financials are based on the most recent Mortgage that was taken out on this home.
Original Mortgage
$173,755
Interest Rate
8.21%
Create a Home Valuation Report for This Property
The Home Valuation Report is an in-depth analysis detailing your home's value as well as a comparison with similar homes in the area
Home Values in the Area
Average Home Value in this Area
Purchase History
| Date | Buyer | Sale Price | Title Company |
|---|---|---|---|
| Potter Steven J | -- | -- | |
| Potter Steven J | $182,900 | -- |
Source: Public Records
Mortgage History
| Date | Status | Borrower | Loan Amount |
|---|---|---|---|
| Open | Potter Steven J | $203,700 | |
| Previous Owner | Potter Steven J | $208,250 | |
| Previous Owner | Potter Steven J | $98,000 | |
| Previous Owner | Potter Steven J | $173,755 |
Source: Public Records
Tax History
| Year | Tax Paid | Tax Assessment Tax Assessment Total Assessment is a certain percentage of the fair market value that is determined by local assessors to be the total taxable value of land and additions on the property. | Land | Improvement |
|---|---|---|---|---|
| 2025 | $11,372 | $495,300 | $120,000 | $375,300 |
| 2024 | $10,852 | $495,300 | $120,000 | $375,300 |
| 2023 | $10,263 | $495,300 | $120,000 | $375,300 |
| 2022 | $9,059 | $495,300 | $120,000 | $375,300 |
| 2021 | $9,220 | $498,100 | $120,000 | $378,100 |
| 2020 | $9,435 | $360,100 | $86,500 | $273,600 |
| 2019 | $9,493 | $360,100 | $86,500 | $273,600 |
| 2018 | $9,240 | $360,100 | $86,500 | $273,600 |
| 2017 | $8,714 | $360,100 | $86,500 | $273,600 |
| 2016 | $8,442 | $355,600 | $86,500 | $269,100 |
| 2015 | $8,154 | $325,100 | $86,500 | $238,600 |
| 2014 | $7,910 | $325,100 | $86,500 | $238,600 |
| 2013 | $7,685 | $325,100 | $86,500 | $238,600 |
Source: Public Records
Map
Nearby Homes
- 10 Darren Dr
- 10 Phyllis Ave
- 42A Chester Rd
- 160 Jennifer Dr
- 12 Tarah Way
- 392 Whittier Dr
- 69 Crestview Way
- 75 Crestview Way
- 65 Crestview Way
- 23 Crestview Way
- 31 Crestview Way
- 61 Crestview Way
- 41 Crestview Way
- 33 Crestview Way
- 73 Crestview Way
- 63 Crestview Way
- 71 Crestview Way
- 5 Autumn Ln
- 37 Christopher Ln
- 3 Autumn Ln
Your Personal Tour Guide
Ask me questions while you tour the home.