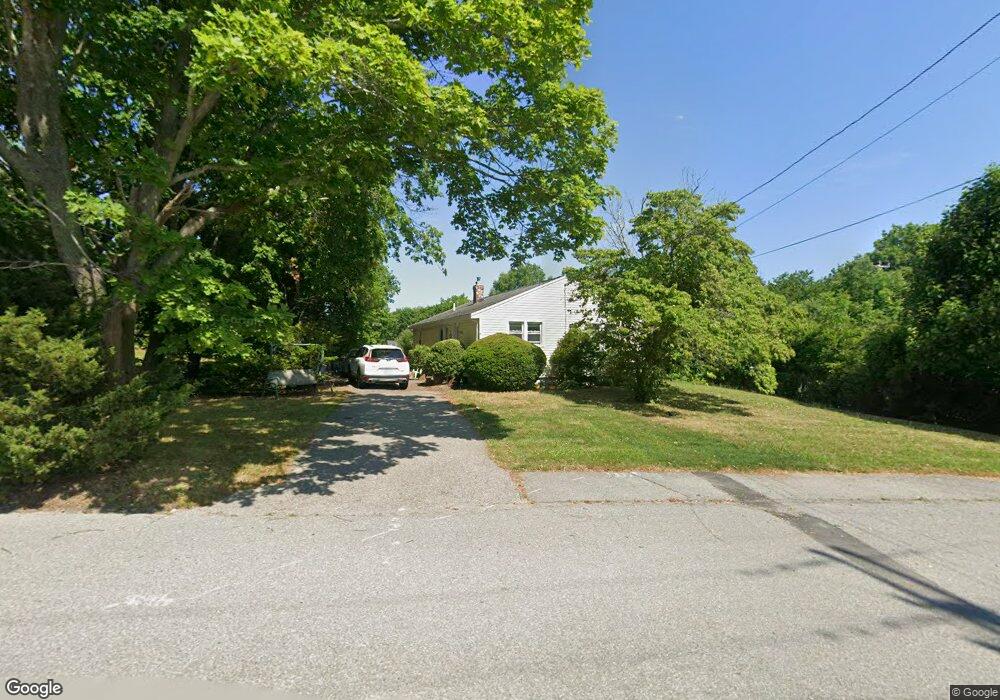
8 Boundary St Kingston, MA 02364
Estimated Value: $441,000 - $544,000
3
Beds
1
Bath
960
Sq Ft
$515/Sq Ft
Est. Value
About This Home
This home is located at 8 Boundary St, Kingston, MA 02364 and is currently estimated at $494,860, approximately $515 per square foot. 8 Boundary St is a home located in Plymouth County with nearby schools including Kingston Elementary School, Silver Lake Regional High School, and Kingston Intermediate School.
Ownership History
Date
Name
Owned For
Owner Type
Purchase Details
Closed on
Feb 22, 2013
Sold by
Golopapenko Maria Y
Bought by
Lansing Ben R and Lansing Richard F
Current Estimated Value
Purchase Details
Closed on
Aug 8, 2012
Sold by
Bank Of America Na
Bought by
Golopapenko Maria
Purchase Details
Closed on
Mar 23, 2012
Sold by
Glass Mona J
Bought by
Bank Of America Na
Purchase Details
Closed on
Nov 12, 2002
Sold by
Laramee Kelly A
Bought by
Glass Mona J
Home Financials for this Owner
Home Financials are based on the most recent Mortgage that was taken out on this home.
Original Mortgage
$199,200
Interest Rate
6.04%
Mortgage Type
Purchase Money Mortgage
Purchase Details
Closed on
Sep 23, 1988
Sold by
Figlioli Matthew
Bought by
Laramee Steven M
Home Financials for this Owner
Home Financials are based on the most recent Mortgage that was taken out on this home.
Original Mortgage
$86,200
Interest Rate
10.51%
Mortgage Type
Purchase Money Mortgage
Create a Home Valuation Report for This Property
The Home Valuation Report is an in-depth analysis detailing your home's value as well as a comparison with similar homes in the area
Home Values in the Area
Average Home Value in this Area
Purchase History
| Date | Buyer | Sale Price | Title Company |
|---|---|---|---|
| Lansing Ben R | $170,000 | -- | |
| Golopapenko Maria | $79,000 | -- | |
| Bank Of America Na | $141,120 | -- | |
| Glass Mona J | $249,900 | -- | |
| Laramee Steven M | $115,000 | -- |
Source: Public Records
Mortgage History
| Date | Status | Borrower | Loan Amount |
|---|---|---|---|
| Previous Owner | Laramee Steven M | $199,200 | |
| Previous Owner | Laramee Steven M | $176,000 | |
| Previous Owner | Laramee Steven M | $86,000 | |
| Previous Owner | Laramee Steven M | $86,200 |
Source: Public Records
Tax History Compared to Growth
Tax History
| Year | Tax Paid | Tax Assessment Tax Assessment Total Assessment is a certain percentage of the fair market value that is determined by local assessors to be the total taxable value of land and additions on the property. | Land | Improvement |
|---|---|---|---|---|
| 2025 | $5,202 | $401,100 | $193,600 | $207,500 |
| 2024 | $4,648 | $365,700 | $168,300 | $197,400 |
| 2023 | $4,441 | $332,400 | $168,300 | $164,100 |
| 2022 | $4,518 | $309,900 | $153,000 | $156,900 |
| 2021 | $4,176 | $259,700 | $140,600 | $119,100 |
| 2020 | $3,894 | $239,200 | $140,600 | $98,600 |
| 2019 | $3,812 | $231,600 | $140,600 | $91,000 |
| 2018 | $3,683 | $223,900 | $140,600 | $83,300 |
| 2017 | $3,587 | $217,400 | $136,600 | $80,800 |
| 2016 | $3,642 | $206,800 | $124,900 | $81,900 |
| 2015 | $3,503 | $206,800 | $124,900 | $81,900 |
| 2014 | $3,496 | $209,600 | $124,900 | $84,700 |
Source: Public Records
Map
Nearby Homes
- 22 Main St Unit A
- 393 Court St Unit 4
- 393 Court St Unit 7
- 393 Court St Unit 5
- 393 Court St Unit 1
- 5-7 Forest Ave
- 62 Spooner St
- 17 Howlands Ln
- 4 S Spooner St Unit 6
- 4 S Spooner St Unit 7
- 4 S Spooner St Unit 8
- 2 S Spooner St Unit 3
- 2 S Spooner St Unit 1
- 2 S Spooner St Unit 4
- 20-22 Hedge Rd
- 70 Hedge Rd
- 94 Main St
- 12 Rome Ave
- 20 Orchard Ave
- Lot 17-3 Howlands Ln