Estimated Value: $499,530 - $560,000
3
Beds
2
Baths
1,822
Sq Ft
$289/Sq Ft
Est. Value
About This Home
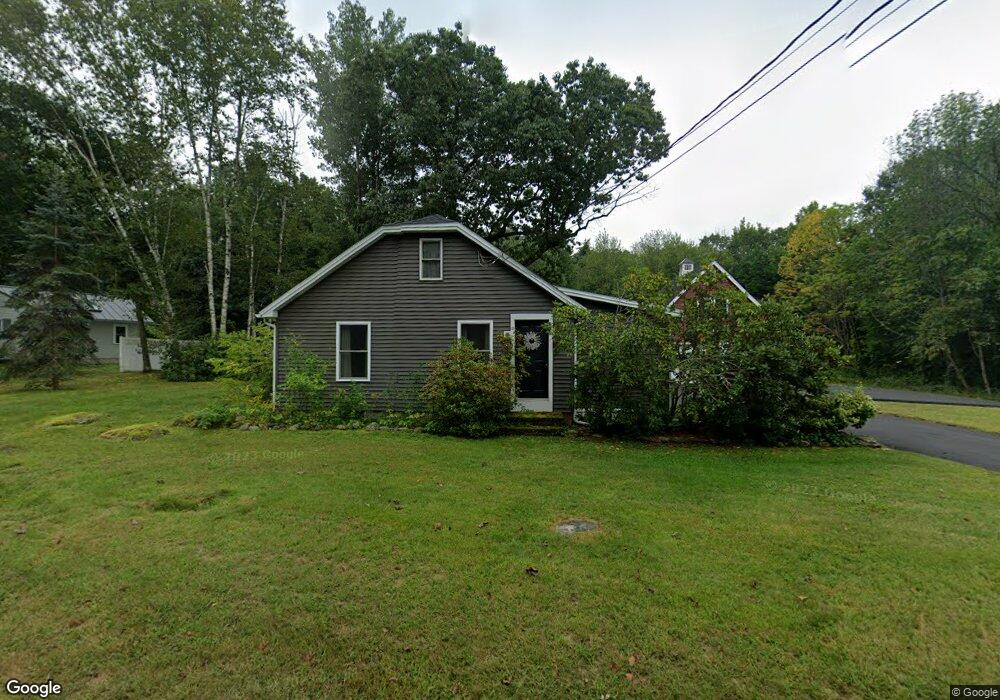
This home is located at 8 Bow Bog Rd, Bow, NH 03304 and is currently estimated at $527,383, approximately $289 per square foot. 8 Bow Bog Rd is a home with nearby schools including Bow Elementary School, Bow Memorial School, and Bow High School.
Ownership History
Date
Name
Owned For
Owner Type
Purchase Details
Closed on
Aug 12, 2021
Sold by
Preston Teresa G and Russo Francis
Bought by
Teresa G Preston Ret
Current Estimated Value
Purchase Details
Closed on
Nov 15, 2005
Sold by
Curtin-Savard Arthur J
Bought by
Russo Francis L and Preston Teresa G
Home Financials for this Owner
Home Financials are based on the most recent Mortgage that was taken out on this home.
Original Mortgage
$196,000
Interest Rate
5.93%
Purchase Details
Closed on
Aug 30, 2000
Sold by
Warriner John D and Warriner Jacqueline M
Bought by
Curtin-Savard Arthur J
Home Financials for this Owner
Home Financials are based on the most recent Mortgage that was taken out on this home.
Original Mortgage
$128,000
Interest Rate
8.16%
Purchase Details
Closed on
Oct 3, 1996
Sold by
Jaskolka Kevin J and Jaskol Robyn M Godbout
Bought by
Warriner John D and Warriner Jacqueline M
Home Financials for this Owner
Home Financials are based on the most recent Mortgage that was taken out on this home.
Original Mortgage
$72,000
Interest Rate
7.9%
Create a Home Valuation Report for This Property
The Home Valuation Report is an in-depth analysis detailing your home's value as well as a comparison with similar homes in the area
Home Values in the Area
Average Home Value in this Area
Purchase History
| Date | Buyer | Sale Price | Title Company |
|---|---|---|---|
| Teresa G Preston Ret | -- | None Available | |
| Russo Francis L | $245,000 | -- | |
| Curtin-Savard Arthur J | $160,000 | -- | |
| Warriner John D | $125,000 | -- |
Source: Public Records
Mortgage History
| Date | Status | Borrower | Loan Amount |
|---|---|---|---|
| Previous Owner | Russo Francis L | $196,000 | |
| Previous Owner | Warriner John D | $128,000 | |
| Previous Owner | Warriner John D | $72,000 |
Source: Public Records
Tax History Compared to Growth
Tax History
| Year | Tax Paid | Tax Assessment Tax Assessment Total Assessment is a certain percentage of the fair market value that is determined by local assessors to be the total taxable value of land and additions on the property. | Land | Improvement |
|---|---|---|---|---|
| 2024 | $7,791 | $393,900 | $161,000 | $232,900 |
| 2023 | $7,384 | $265,500 | $108,400 | $157,100 |
| 2022 | $7,041 | $265,500 | $108,400 | $157,100 |
| 2021 | $6,747 | $264,700 | $108,400 | $156,300 |
| 2020 | $6,771 | $264,700 | $108,400 | $156,300 |
| 2019 | $6,938 | $264,700 | $108,400 | $156,300 |
| 2018 | $5,556 | $200,000 | $100,100 | $99,900 |
| 2017 | $5,554 | $200,000 | $100,100 | $99,900 |
| 2016 | $5,258 | $200,000 | $100,100 | $99,900 |
| 2015 | $5,428 | $190,200 | $100,100 | $90,100 |
| 2014 | $5,660 | $191,800 | $100,100 | $91,700 |
| 2011 | $5,332 | $196,400 | $100,100 | $96,300 |
Source: Public Records
Map
Nearby Homes
- 29 Westover Ln
- 77 White Rock Hill Rd
- 40 Sawmill Rd
- 4 Bow Center Rd Unit F2
- 4 Bow Center Rd Unit B2
- 49 Robinson Rd
- 36 Westover Ln Unit k
- 5 Holly Cir
- 42 Westover Ln
- 6 Woodland Cir
- 24 Grandview Rd
- 104 Brown Hill Rd
- 0 Brown Hill Rd Unit 5032600
- 1 Hop Kiln Rd
- 43 Sterling Place
- 70 Gile Hill Rd
- 53 Heather Ln
- 5 Longview Dr
- 7 Morgan Dr
- 8 Longview Dr