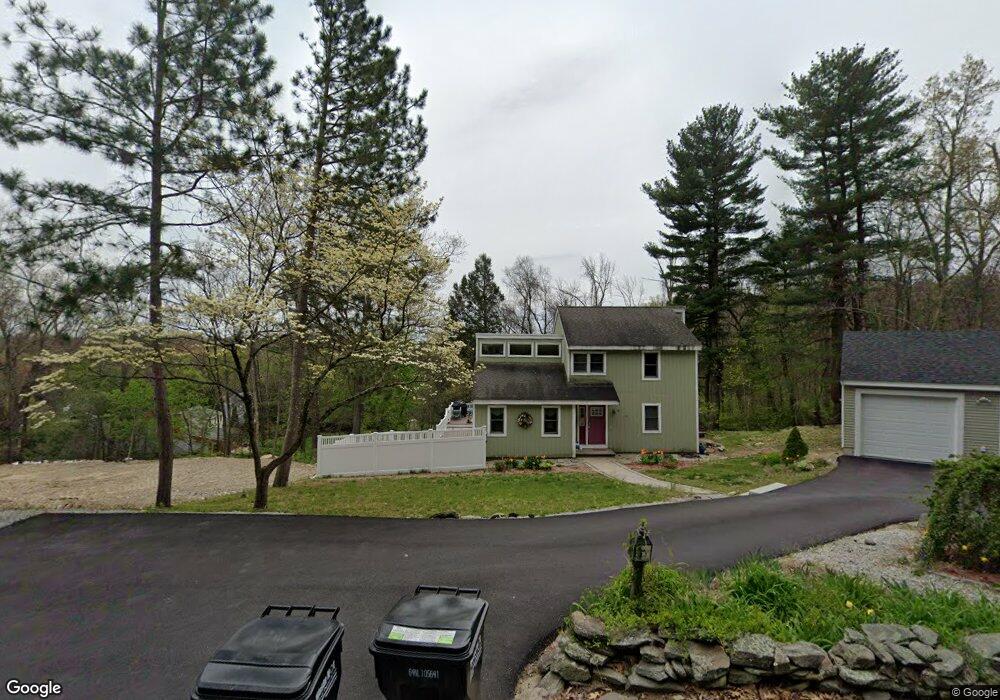
8 Boxboro Rd Littleton, MA 01460
Estimated Value: $779,537 - $1,051,000
3
Beds
4
Baths
2,152
Sq Ft
$416/Sq Ft
Est. Value
About This Home
This home is located at 8 Boxboro Rd, Littleton, MA 01460 and is currently estimated at $894,884, approximately $415 per square foot. 8 Boxboro Rd is a home located in Middlesex County with nearby schools including Shaker Lane Elementary School, Russell Street Elementary School, and Littleton Middle School.
Ownership History
Date
Name
Owned For
Owner Type
Purchase Details
Closed on
Nov 24, 2020
Sold by
Angell Scott H and Angell Patricia A
Bought by
Keenan & So Llc
Current Estimated Value
Home Financials for this Owner
Home Financials are based on the most recent Mortgage that was taken out on this home.
Original Mortgage
$315,000
Outstanding Balance
$279,665
Interest Rate
2.8%
Mortgage Type
New Conventional
Estimated Equity
$615,219
Create a Home Valuation Report for This Property
The Home Valuation Report is an in-depth analysis detailing your home's value as well as a comparison with similar homes in the area
Home Values in the Area
Average Home Value in this Area
Purchase History
| Date | Buyer | Sale Price | Title Company |
|---|---|---|---|
| Keenan & So Llc | $120,000 | None Available | |
| Angell Patricia A | -- | None Available |
Source: Public Records
Mortgage History
| Date | Status | Borrower | Loan Amount |
|---|---|---|---|
| Open | Angell Patricia A | $315,000 | |
| Closed | Keenan & So Llc | $390,000 |
Source: Public Records
Tax History Compared to Growth
Tax History
| Year | Tax Paid | Tax Assessment Tax Assessment Total Assessment is a certain percentage of the fair market value that is determined by local assessors to be the total taxable value of land and additions on the property. | Land | Improvement |
|---|---|---|---|---|
| 2025 | $102 | $689,000 | $253,100 | $435,900 |
| 2024 | $8,951 | $603,200 | $244,500 | $358,700 |
| 2023 | $8,681 | $534,200 | $202,700 | $331,500 |
| 2022 | $8,134 | $459,300 | $202,700 | $256,600 |
| 2021 | $7,924 | $447,700 | $191,100 | $256,600 |
| 2020 | $7,437 | $418,500 | $176,200 | $242,300 |
| 2019 | $7,196 | $394,500 | $149,400 | $245,100 |
| 2018 | $7,205 | $397,200 | $153,300 | $243,900 |
| 2017 | $7,069 | $389,500 | $145,600 | $243,900 |
| 2016 | $6,888 | $389,400 | $145,600 | $243,800 |
| 2015 | $6,735 | $372,100 | $126,400 | $245,700 |
Source: Public Records
Map
Nearby Homes
- 4 Omega Way
- 305 Harwood Ave
- 4 Huron Rd
- 146 Tahattawan Rd
- 31 Mohawk Dr
- 62 Waite Rd
- Lot 2 Strawberry Farm
- 35 Queen Rd
- 221 Foster St
- 9 Elm St Unit 1
- 5 Elm St Unit 1
- 18 Long Lake Rd
- 777 Depot Rd
- 63 Leonard Rd Unit 63
- 134 Russet Ln
- 16 Fletcher Ln
- 68 Macintosh Ln
- 285 Central St Unit 285
- 4 Mars Place
- 18 Pleasant St