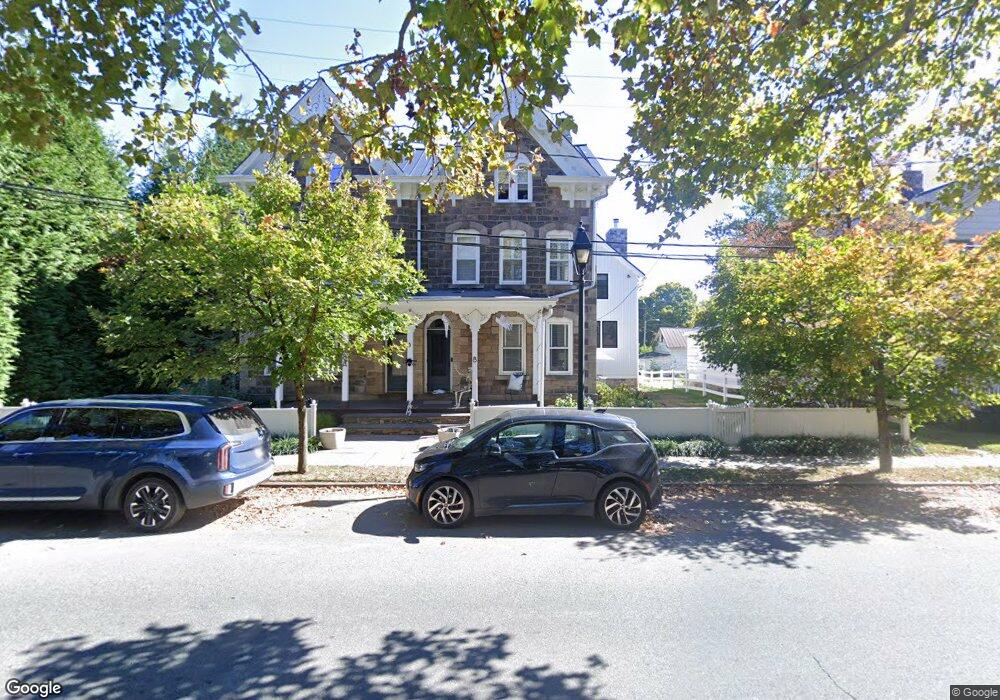
8 Bridge St Stockton, NJ 08559
Estimated Value: $590,000 - $968,000
--
Bed
--
Bath
4,246
Sq Ft
$182/Sq Ft
Est. Value
About This Home
This home is located at 8 Bridge St, Stockton, NJ 08559 and is currently estimated at $773,561, approximately $182 per square foot. 8 Bridge St is a home located in Hunterdon County with nearby schools including South Hunterdon High School, The Jesus School, and Solebury School.
Ownership History
Date
Name
Owned For
Owner Type
Purchase Details
Closed on
May 24, 2022
Sold by
Hemenway Group Llc
Bought by
Junius Ryan and Junius Elizabeth
Current Estimated Value
Home Financials for this Owner
Home Financials are based on the most recent Mortgage that was taken out on this home.
Original Mortgage
$500,000
Outstanding Balance
$474,346
Interest Rate
5.1%
Mortgage Type
New Conventional
Estimated Equity
$299,215
Purchase Details
Closed on
Dec 27, 2017
Sold by
Junius Ryan D and Junius Elizabeth A
Bought by
The Hemenway Group Llc
Purchase Details
Closed on
Aug 16, 2017
Sold by
Klempert Andrea P and Klempert Paul D
Bought by
Jenius Ryan D and Jenius Elizabeth A
Home Financials for this Owner
Home Financials are based on the most recent Mortgage that was taken out on this home.
Original Mortgage
$131,250
Interest Rate
4.03%
Mortgage Type
New Conventional
Purchase Details
Closed on
Nov 21, 2009
Sold by
Palmer Marge
Bought by
Palmer Marge and Klempert Andrea
Create a Home Valuation Report for This Property
The Home Valuation Report is an in-depth analysis detailing your home's value as well as a comparison with similar homes in the area
Home Values in the Area
Average Home Value in this Area
Purchase History
| Date | Buyer | Sale Price | Title Company |
|---|---|---|---|
| Junius Ryan | -- | None Listed On Document | |
| The Hemenway Group Llc | -- | None Available | |
| Jenius Ryan D | $175,000 | None Available | |
| Palmer Marge | -- | None Available |
Source: Public Records
Mortgage History
| Date | Status | Borrower | Loan Amount |
|---|---|---|---|
| Open | Junius Ryan | $500,000 | |
| Previous Owner | Jenius Ryan D | $131,250 |
Source: Public Records
Tax History Compared to Growth
Tax History
| Year | Tax Paid | Tax Assessment Tax Assessment Total Assessment is a certain percentage of the fair market value that is determined by local assessors to be the total taxable value of land and additions on the property. | Land | Improvement |
|---|---|---|---|---|
| 2025 | $11,912 | $622,700 | $150,600 | $472,100 |
| 2024 | $12,174 | $622,700 | $150,600 | $472,100 |
| 2023 | $12,174 | $622,700 | $150,600 | $472,100 |
| 2022 | $7,357 | $350,000 | $160,000 | $190,000 |
| 2021 | $7,357 | $350,000 | $160,000 | $190,000 |
| 2020 | $7,266 | $350,000 | $160,000 | $190,000 |
| 2019 | $7,245 | $350,000 | $160,000 | $190,000 |
| 2018 | $5,783 | $350,000 | $160,000 | $190,000 |
| 2017 | $5,783 | $406,900 | $273,600 | $133,300 |
| 2016 | $8,468 | $406,900 | $273,600 | $133,300 |
| 2015 | $8,402 | $406,900 | $273,600 | $133,300 |
| 2014 | $8,378 | $406,900 | $273,600 | $133,300 |
Source: Public Records
Map
Nearby Homes
- 9 Mill St
- 5 Ferry St
- 13 S Main St
- 8 Church St
- 2 Broad St
- 2 Old Prallsville Rd
- 36 S Main St
- 7189 Center Bridge Rd
- 925 Sergeantsville Rd
- 6950 Upper York Rd
- 7000 Ely Rd
- 7043 Phillips Mill Rd
- 6853 Phillips Mill Rd
- 6859 Phillips Mill Rd
- 3014 Comfort Rd
- 86 Kingwood Stockton Rd
- 2999 Comfort Rd
- 3 Covered Bridge Rd
- 6633 School Ln
- 760 Rosemont Ringoes Rd
- 8 Bridge St
- 8 Bridge St
- 8 Bridge St Unit A
- 8A Bridge St
- 6 Bridge St
- 4 Bridge St
- 11 Bridge St
- 11 Bridge St Unit 2
- 1 Mill St
- 9 Bridge St
- 7 Bridge St
- 5 Bridge St
- 2 Mill St
- 2 Bridge St
- 9 Bridge St
- 13 Bridge St Unit 1 2nd Fl
- 13 Bridge St Unit 2nd Fl Unit 1
- 13 Bridge St
- 13 Bridge St Unit 2
- 1 S Railroad Ave