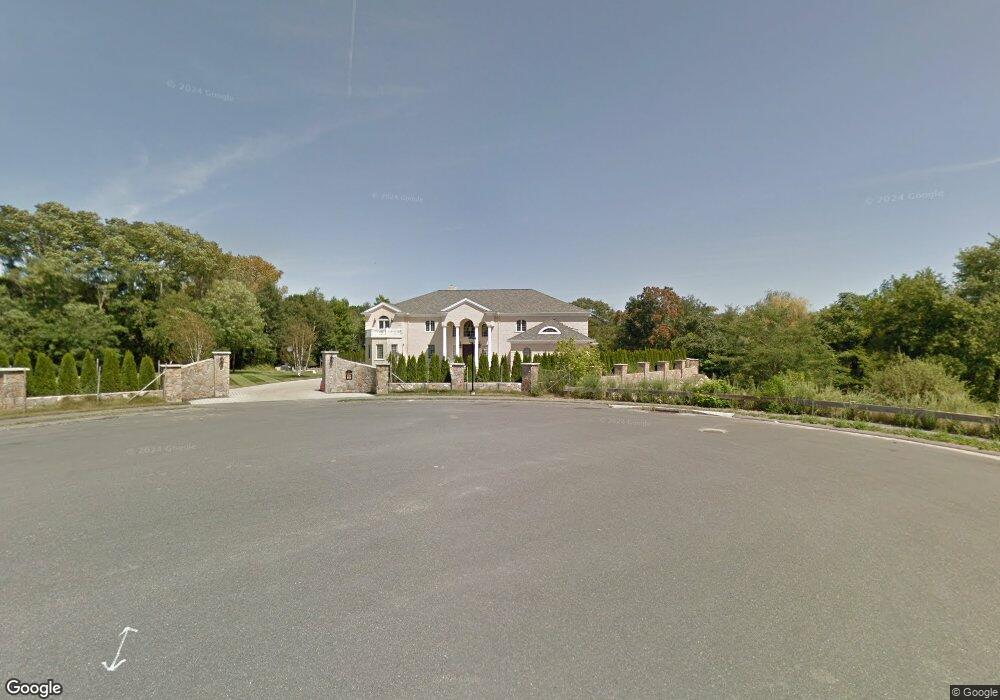
8 Bridle Path Lynnfield, MA 01940
Estimated Value: $2,730,000 - $2,828,481
4
Beds
6
Baths
7,451
Sq Ft
$375/Sq Ft
Est. Value
About This Home
This home is located at 8 Bridle Path, Lynnfield, MA 01940 and is currently estimated at $2,795,494, approximately $375 per square foot. 8 Bridle Path is a home located in Essex County with nearby schools including Lynnfield Middle School, Lynnfield High School, and Covenant Christian Academy.
Ownership History
Date
Name
Owned For
Owner Type
Purchase Details
Closed on
Jun 4, 2025
Sold by
Bridle Development Llc
Bought by
Nakashian Michael
Current Estimated Value
Purchase Details
Closed on
Dec 31, 2012
Sold by
Nakashian Michael and Nakashian Mari
Bought by
Bridle Dev Llc
Home Financials for this Owner
Home Financials are based on the most recent Mortgage that was taken out on this home.
Original Mortgage
$1,230,000
Interest Rate
3.46%
Mortgage Type
Stand Alone Refi Refinance Of Original Loan
Purchase Details
Closed on
Feb 15, 2011
Sold by
Nakashian Michael and Nakashian Mari
Bought by
Nakashian Michael and Nakashian Mari
Purchase Details
Closed on
Jul 23, 2010
Sold by
Dawson Dawn and Dawson Jerry
Bought by
Nakashian Michael and Nakashian Mari
Create a Home Valuation Report for This Property
The Home Valuation Report is an in-depth analysis detailing your home's value as well as a comparison with similar homes in the area
Home Values in the Area
Average Home Value in this Area
Purchase History
| Date | Buyer | Sale Price | Title Company |
|---|---|---|---|
| Nakashian Michael | -- | None Available | |
| Nakashian Michael | -- | None Available | |
| Nakashian Michael | -- | None Available | |
| Bridle Dev Llc | -- | -- | |
| Bridle Dev Llc | -- | -- | |
| Nakashian Michael | -- | -- | |
| Nakashian Michael | -- | -- | |
| Nakashian Michael | -- | -- | |
| Nakashian Michael | $535,000 | -- | |
| Nakashian Michael | $535,000 | -- |
Source: Public Records
Mortgage History
| Date | Status | Borrower | Loan Amount |
|---|---|---|---|
| Previous Owner | Nakashian Michael | $1,230,000 | |
| Previous Owner | Nakashian Michael | $900,000 |
Source: Public Records
Tax History
| Year | Tax Paid | Tax Assessment Tax Assessment Total Assessment is a certain percentage of the fair market value that is determined by local assessors to be the total taxable value of land and additions on the property. | Land | Improvement |
|---|---|---|---|---|
| 2025 | $27,781 | $2,630,800 | $994,400 | $1,636,400 |
| 2024 | $25,239 | $2,401,400 | $904,100 | $1,497,300 |
| 2023 | $24,599 | $2,176,900 | $904,100 | $1,272,800 |
| 2022 | $23,484 | $1,958,600 | $808,500 | $1,150,100 |
| 2021 | $23,062 | $1,737,900 | $806,400 | $931,500 |
| 2020 | $20,749 | $1,490,600 | $552,300 | $938,300 |
| 2019 | $20,309 | $1,460,000 | $521,700 | $938,300 |
| 2018 | $20,090 | $1,460,000 | $521,700 | $938,300 |
| 2017 | $20,119 | $1,460,000 | $521,700 | $938,300 |
| 2016 | $19,355 | $1,334,800 | $447,300 | $887,500 |
| 2015 | $19,341 | $1,334,800 | $447,300 | $887,500 |
Source: Public Records
Map
Nearby Homes
- 2 Bridle Path
- 12 Heritage Ln
- 6 Ashley Ct
- 35 Lincoln Ave
- 159 Main St
- 11 Elizabeth Way
- 6 Glen Dr
- 25 Juniper Ave
- 18 Symonds Way
- 4 Lowell St
- 67 Woodcrest Dr
- 0 Charles St Unit 72374573
- 17 Marshall St
- 4 Hickory Ln
- 15 Fairway Ln Unit 55
- 15 Park St Unit A
- 15 Park St Unit B
- 15 Park St
- 19 Fairway Ln Unit 53
- 270 Lowell St
- 6 Bridle Path
- 16 Charing Cross
- 7 Bridle Path
- 159 Chestnut St
- 14 Charing Cross
- 11 Charing Cross
- 5 Bridle Path
- 4 Bridle Path
- 4 Bridle Path
- 12 Charing Cross
- 7 Haywood Farm
- 3 Bridle Path
- 9 Charing Cross
- 10 Charing Cross
- 8 Charing Cross
- 135 Chestnut St
- 8 Haywood Farm
- 177 Chestnut St
- 5 Haywood Farm
- 19 Grayland Rd
Your Personal Tour Guide
Ask me questions while you tour the home.