Estimated Value: $615,000 - $723,000
2
Beds
1
Bath
905
Sq Ft
$723/Sq Ft
Est. Value
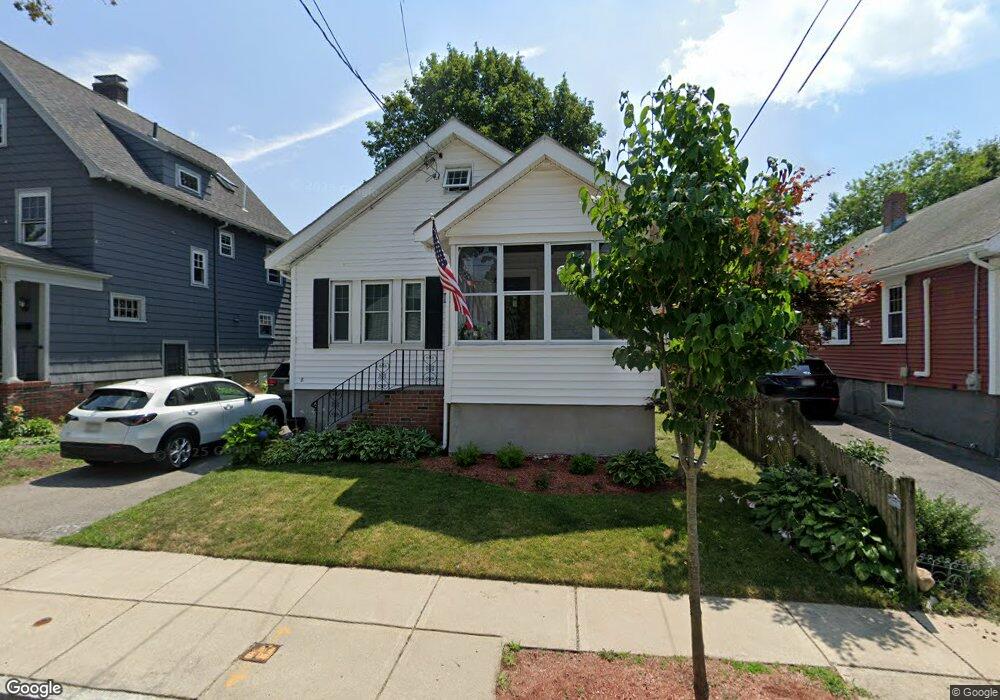
About This Home
This home is located at 8 Brier Rd, West Roxbury, MA 02132 and is currently estimated at $654,414, approximately $723 per square foot. 8 Brier Rd is a home located in Suffolk County with nearby schools including St Theresa School, Holy Name Parish School, and The Roxbury Latin School.
Ownership History
Date
Name
Owned For
Owner Type
Purchase Details
Closed on
Oct 13, 2020
Sold by
Schofield Kevin M and Schofield Karen M
Bought by
Ronayne Colin and Murphy Shannon
Current Estimated Value
Home Financials for this Owner
Home Financials are based on the most recent Mortgage that was taken out on this home.
Original Mortgage
$484,500
Outstanding Balance
$427,022
Interest Rate
2.9%
Mortgage Type
New Conventional
Estimated Equity
$227,392
Purchase Details
Closed on
Jun 1, 2007
Sold by
Kevin Michael Mcnamara
Bought by
Schofield Karen M and Schofield Kevin M
Home Financials for this Owner
Home Financials are based on the most recent Mortgage that was taken out on this home.
Original Mortgage
$294,500
Interest Rate
6.24%
Mortgage Type
Purchase Money Mortgage
Purchase Details
Closed on
Oct 12, 2006
Sold by
Mcnamara Kevin M
Bought by
Kevin Michael Mcnamara
Create a Home Valuation Report for This Property
The Home Valuation Report is an in-depth analysis detailing your home's value as well as a comparison with similar homes in the area
Home Values in the Area
Average Home Value in this Area
Purchase History
| Date | Buyer | Sale Price | Title Company |
|---|---|---|---|
| Ronayne Colin | $510,000 | None Available | |
| Schofield Karen M | $310,000 | -- | |
| Kevin Michael Mcnamara | -- | -- |
Source: Public Records
Mortgage History
| Date | Status | Borrower | Loan Amount |
|---|---|---|---|
| Open | Ronayne Colin | $484,500 | |
| Previous Owner | Schofield Karen M | $294,500 |
Source: Public Records
Tax History
| Year | Tax Paid | Tax Assessment Tax Assessment Total Assessment is a certain percentage of the fair market value that is determined by local assessors to be the total taxable value of land and additions on the property. | Land | Improvement |
|---|---|---|---|---|
| 2025 | $6,238 | $538,700 | $199,300 | $339,400 |
| 2024 | $5,667 | $519,900 | $216,700 | $303,200 |
| 2023 | $5,267 | $490,400 | $204,400 | $286,000 |
| 2022 | $4,850 | $445,800 | $185,800 | $260,000 |
| 2021 | $4,443 | $416,400 | $180,400 | $236,000 |
| 2020 | $4,020 | $380,700 | $163,000 | $217,700 |
| 2019 | $3,758 | $356,500 | $139,600 | $216,900 |
| 2018 | $3,557 | $339,400 | $139,600 | $199,800 |
| 2017 | $3,557 | $335,900 | $139,600 | $196,300 |
| 2016 | $3,486 | $316,900 | $139,600 | $177,300 |
| 2015 | $3,681 | $304,000 | $147,900 | $156,100 |
| 2014 | $3,571 | $283,900 | $147,900 | $136,000 |
Source: Public Records
Map
Nearby Homes
- 78 Howitt Rd
- 73 Woodard Rd
- 348 Lagrange St
- 35 Heron St
- 17 Starling St
- 16 Starling St
- 205 Park St Unit 2
- 14 Heron St Unit 14-207
- 14 Heron St Unit 210
- 4925 Washington St Unit 201
- 2231 Centre St
- 37 Pelton St
- 425 Lagrange St Unit 203
- 4975 Washington St Unit 306
- 4975 Washington St Unit 305
- 15 Cass St Unit 3
- 17 Cass St Unit 4
- 17 Hastings St Unit 5
- 116 Spring St Unit D2
- 4 Anawan Ave Unit 7
Your Personal Tour Guide
Ask me questions while you tour the home.