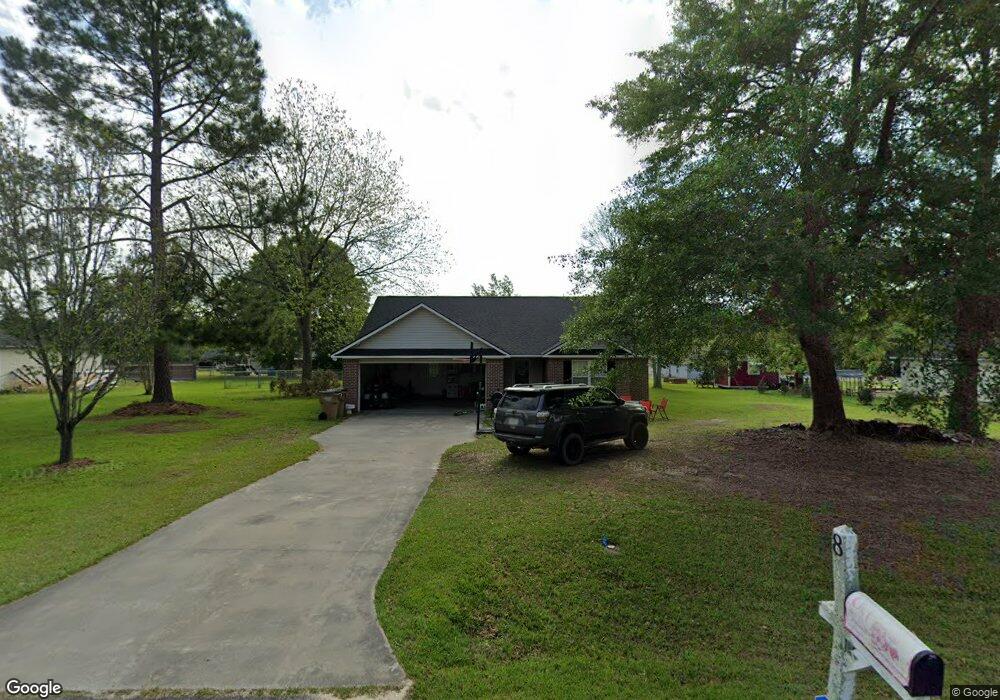
8 Brodie Ln Tifton, GA 31793
Estimated Value: $216,000 - $243,000
3
Beds
2
Baths
1,416
Sq Ft
$163/Sq Ft
Est. Value
About This Home
This home is located at 8 Brodie Ln, Tifton, GA 31793 and is currently estimated at $230,284, approximately $162 per square foot. 8 Brodie Ln is a home located in Tift County with nearby schools including Matt Wilson Elementary School, J.T. Reddick School, and Annie Belle Clark Primary School.
Ownership History
Date
Name
Owned For
Owner Type
Purchase Details
Closed on
Jul 17, 2012
Sold by
Smith Matthew C
Bought by
Walker Michael Shane
Current Estimated Value
Home Financials for this Owner
Home Financials are based on the most recent Mortgage that was taken out on this home.
Original Mortgage
$103,098
Outstanding Balance
$70,148
Interest Rate
3.37%
Mortgage Type
FHA
Estimated Equity
$160,136
Purchase Details
Closed on
Aug 5, 2011
Sold by
Cruce Mary L
Bought by
Smith Matthew C and Smith Jasmine C
Home Financials for this Owner
Home Financials are based on the most recent Mortgage that was taken out on this home.
Original Mortgage
$97,367
Interest Rate
4.5%
Mortgage Type
FHA
Purchase Details
Closed on
Oct 20, 2006
Sold by
Walker Michele
Bought by
Walker Michele and Walker Larry Steven
Purchase Details
Closed on
Jul 3, 2002
Sold by
Scottish Homes Llc
Bought by
Cruce Mary L
Purchase Details
Closed on
May 24, 2001
Bought by
Kellcreek Development Ll
Create a Home Valuation Report for This Property
The Home Valuation Report is an in-depth analysis detailing your home's value as well as a comparison with similar homes in the area
Home Values in the Area
Average Home Value in this Area
Purchase History
| Date | Buyer | Sale Price | Title Company |
|---|---|---|---|
| Walker Michael Shane | $105,000 | -- | |
| Smith Matthew C | $99,900 | -- | |
| Walker Michele | -- | -- | |
| Cruce Mary L | $92,000 | -- | |
| Scottish Homes Llc | $12,500 | -- | |
| Kellcreek Development Ll | -- | -- |
Source: Public Records
Mortgage History
| Date | Status | Borrower | Loan Amount |
|---|---|---|---|
| Open | Walker Michael Shane | $103,098 | |
| Previous Owner | Smith Matthew C | $97,367 |
Source: Public Records
Tax History Compared to Growth
Tax History
| Year | Tax Paid | Tax Assessment Tax Assessment Total Assessment is a certain percentage of the fair market value that is determined by local assessors to be the total taxable value of land and additions on the property. | Land | Improvement |
|---|---|---|---|---|
| 2024 | $1,763 | $77,990 | $12,000 | $65,990 |
| 2023 | $1,849 | $46,642 | $5,000 | $41,642 |
| 2022 | $1,443 | $46,642 | $5,000 | $41,642 |
| 2021 | $1,451 | $46,642 | $5,000 | $41,642 |
| 2020 | $1,222 | $38,256 | $5,000 | $33,256 |
| 2019 | $1,220 | $38,256 | $5,000 | $33,256 |
| 2018 | $1,218 | $38,256 | $5,000 | $33,256 |
| 2017 | $1,223 | $38,256 | $5,000 | $33,256 |
| 2016 | $1,224 | $38,256 | $5,000 | $33,256 |
| 2015 | $1,224 | $38,256 | $5,000 | $33,256 |
| 2014 | $1,230 | $38,256 | $5,000 | $33,256 |
| 2013 | -- | $38,256 | $5,000 | $33,256 |
Source: Public Records
Map
Nearby Homes
- 45 Surrey Cir
- 33 Surrey Cir
- 4716 Union Rd
- 27 Water's Edge Way
- 54 Jacks Way
- 17 Waters Edge Way
- 0 Union Industrial Way
- 187 Bussell Rd
- 4554 Carpenter Rd S
- 0 Jordan Rd
- 4502 Carpenter Rd S
- 1802 Golden Rd W
- 0 Deer Run Cir
- 5015 Union Rd
- 4480 Union Rd
- 4104 London Ln
- 0 Union Rd
- 604 Golden Rd W
- 64 Palmetta Rd
- 100 Palmetta Rd