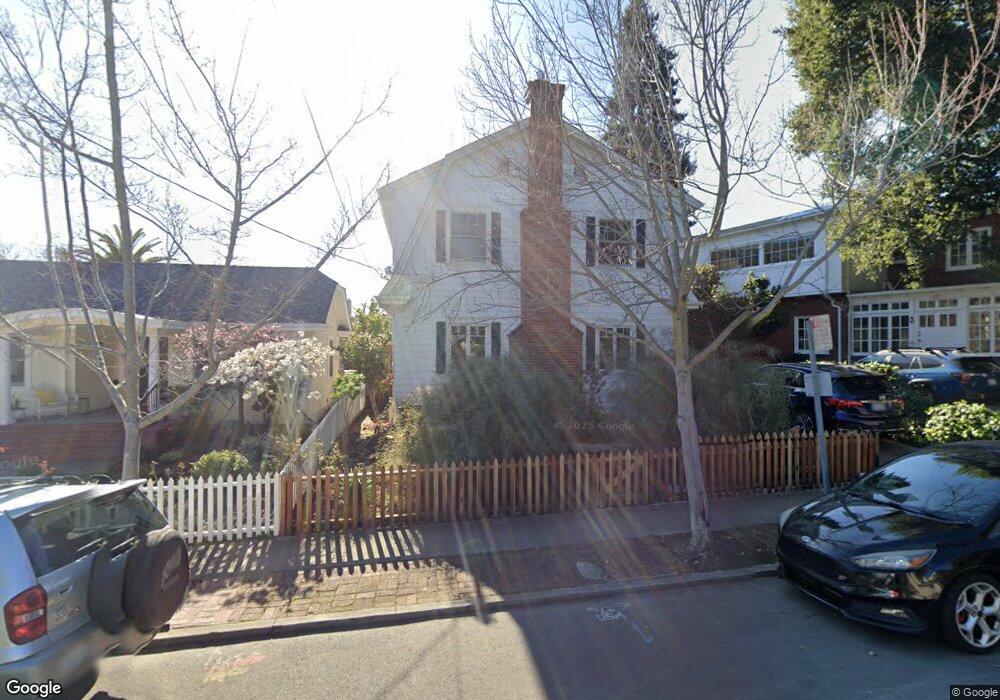
8 Brookside Ave Berkeley, CA 94705
Claremont NeighborhoodEstimated Value: $2,317,000 - $3,093,000
4
Beds
3
Baths
2,603
Sq Ft
$1,004/Sq Ft
Est. Value
About This Home
This home is located at 8 Brookside Ave, Berkeley, CA 94705 and is currently estimated at $2,612,525, approximately $1,003 per square foot. 8 Brookside Ave is a home located in Alameda County with nearby schools including John Muir Elementary School, Emerson Elementary School, and Malcolm X Elementary School.
Ownership History
Date
Name
Owned For
Owner Type
Purchase Details
Closed on
Sep 30, 2021
Sold by
Schwartz Tessa J and Power Boy D
Bought by
Schwartz Tessa J and Power Boy D
Current Estimated Value
Purchase Details
Closed on
Mar 15, 2005
Sold by
Cogswell Colby A and Cogswell Anne J
Bought by
Power Boyd D and Schwartz Tessa J
Home Financials for this Owner
Home Financials are based on the most recent Mortgage that was taken out on this home.
Original Mortgage
$1,100,000
Outstanding Balance
$557,671
Interest Rate
5.61%
Mortgage Type
Purchase Money Mortgage
Estimated Equity
$2,054,854
Purchase Details
Closed on
Jul 29, 2003
Sold by
Cogswell Colby A and Cogswell Anne J
Bought by
Cogswell Colby A and Cogswell Anne J
Home Financials for this Owner
Home Financials are based on the most recent Mortgage that was taken out on this home.
Original Mortgage
$800,000
Interest Rate
5%
Mortgage Type
Purchase Money Mortgage
Create a Home Valuation Report for This Property
The Home Valuation Report is an in-depth analysis detailing your home's value as well as a comparison with similar homes in the area
Home Values in the Area
Average Home Value in this Area
Purchase History
| Date | Buyer | Sale Price | Title Company |
|---|---|---|---|
| Schwartz Tessa J | -- | None Available | |
| Power Boyd D | -- | Old Republic Title Company | |
| Cogswell Colby A | -- | Old Republic Title Company |
Source: Public Records
Mortgage History
| Date | Status | Borrower | Loan Amount |
|---|---|---|---|
| Open | Power Boyd D | $1,100,000 | |
| Previous Owner | Cogswell Colby A | $800,000 |
Source: Public Records
Tax History
| Year | Tax Paid | Tax Assessment Tax Assessment Total Assessment is a certain percentage of the fair market value that is determined by local assessors to be the total taxable value of land and additions on the property. | Land | Improvement |
|---|---|---|---|---|
| 2025 | $27,134 | $2,091,727 | $556,118 | $1,535,609 |
| 2024 | $27,134 | $1,844,391 | $545,217 | $1,299,174 |
| 2023 | $26,298 | $1,781,760 | $534,528 | $1,247,232 |
| 2022 | $25,568 | $1,746,834 | $524,050 | $1,222,784 |
| 2021 | $25,665 | $1,712,587 | $513,776 | $1,198,811 |
| 2020 | $24,370 | $1,695,031 | $508,509 | $1,186,522 |
| 2019 | $23,510 | $1,661,807 | $498,542 | $1,163,265 |
| 2018 | $23,147 | $1,629,236 | $488,771 | $1,140,465 |
| 2017 | $22,383 | $1,597,303 | $479,191 | $1,118,112 |
| 2016 | $21,745 | $1,565,994 | $469,798 | $1,096,196 |
| 2015 | $21,469 | $1,542,480 | $462,744 | $1,079,736 |
| 2014 | $19,950 | $1,400,000 | $420,000 | $980,000 |
Source: Public Records
Map
Nearby Homes
- 2800 Prince St
- 2962 Piedmont Ave
- 360 Alcatraz Ave
- 6100 Chabot Rd
- 2477 Prince St
- 6446 Colby St
- 5910 Chabot Rd
- 6189 Margarido Dr
- 204 El Camino Real
- 5936 Broadway
- 2817 Palm Ct
- 2935 Florence St
- 2643 Stuart St
- 2917 Telegraph Ave
- 1488 Alvarado Rd
- 5883 Margarido Dr
- 641 Alvarado Rd
- 5466 Shafter Ave
- 5668 Buena Vista Ave
- 0 Tunnel Rd
- 12 Brookside Ave
- 2 Brookside Ave
- 3209 Claremont Ave
- 16 Brookside Ave
- 3 Eton Ct
- 1 Eton Ct
- 5 Eton Ct
- 20 Brookside Ave
- 20 Hillcrest Rd
- 9 Brookside Ave
- 24 Hillcrest Rd
- 7 Eton Ct
- 3148 Claremont Ave
- 3144 Claremont Ave
- 3130 Claremont Ave
- 190 Brookside Dr
- 26 Brookside Ave
- 3135 Claremont Ave
- 10 Hillcrest Rd
- 3301 Claremont Ave
Your Personal Tour Guide
Ask me questions while you tour the home.