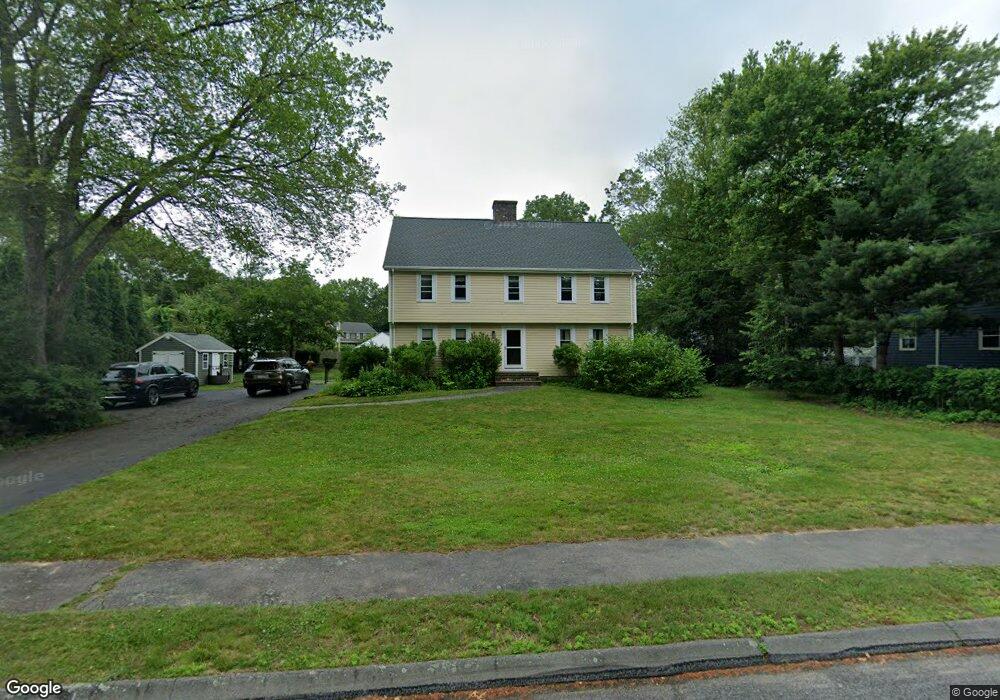
8 Brookside Rd Mansfield, MA 02048
Estimated Value: $726,041 - $827,000
4
Beds
2
Baths
2,320
Sq Ft
$335/Sq Ft
Est. Value
About This Home
This home is located at 8 Brookside Rd, Mansfield, MA 02048 and is currently estimated at $777,510, approximately $335 per square foot. 8 Brookside Rd is a home located in Bristol County with nearby schools including Everett W. Robinson Elementary School, Jordan/Jackson Elementary School, and Harold L. Qualters Middle School.
Ownership History
Date
Name
Owned For
Owner Type
Purchase Details
Closed on
Aug 1, 1995
Sold by
Malone Michael K and Malone Nancy A
Bought by
Holt Stephen H and Holt Patricia A
Current Estimated Value
Home Financials for this Owner
Home Financials are based on the most recent Mortgage that was taken out on this home.
Original Mortgage
$93,000
Interest Rate
7.56%
Mortgage Type
Purchase Money Mortgage
Create a Home Valuation Report for This Property
The Home Valuation Report is an in-depth analysis detailing your home's value as well as a comparison with similar homes in the area
Home Values in the Area
Average Home Value in this Area
Purchase History
| Date | Buyer | Sale Price | Title Company |
|---|---|---|---|
| Holt Stephen H | $203,000 | -- |
Source: Public Records
Mortgage History
| Date | Status | Borrower | Loan Amount |
|---|---|---|---|
| Closed | Holt Stephen H | $93,000 | |
| Previous Owner | Holt Stephen H | $30,000 |
Source: Public Records
Tax History
| Year | Tax Paid | Tax Assessment Tax Assessment Total Assessment is a certain percentage of the fair market value that is determined by local assessors to be the total taxable value of land and additions on the property. | Land | Improvement |
|---|---|---|---|---|
| 2025 | $8,561 | $650,000 | $253,400 | $396,600 |
| 2024 | $8,280 | $613,300 | $241,900 | $371,400 |
| 2023 | $7,974 | $565,900 | $241,900 | $324,000 |
| 2022 | $7,641 | $503,700 | $223,900 | $279,800 |
| 2021 | $5,284 | $499,200 | $213,300 | $285,900 |
| 2020 | $5,013 | $464,900 | $186,600 | $278,300 |
| 2019 | $6,978 | $458,500 | $177,700 | $280,800 |
| 2018 | $4 | $445,000 | $169,300 | $275,700 |
| 2017 | $6,495 | $432,400 | $164,400 | $268,000 |
| 2016 | $6,227 | $404,100 | $156,500 | $247,600 |
| 2015 | $6,065 | $391,300 | $156,500 | $234,800 |
Source: Public Records
Map
Nearby Homes
- 14 Claire Ave
- 2 Oak St Unit 2B
- 451R Gilbert St
- 150 Gilbert St
- 250 Mansfield Ave Unit 11
- 128 Tremont St
- 71 Richardson Ave
- 343 Godfrey Dr
- 143 Oak St Unit 10
- 49 Pheasant Hill Rd
- 24 Maverick Dr
- 1769 West St
- 157 Mansfield Ave Unit 27
- 157 Mansfield Ave Unit 14
- 10 Walter St
- 19 Barberry Rd
- 16 Holly Rd
- 5 Village Way Unit C
- 345 Richardson Ave
- 20 John F. Kennedy Dr
Your Personal Tour Guide
Ask me questions while you tour the home.