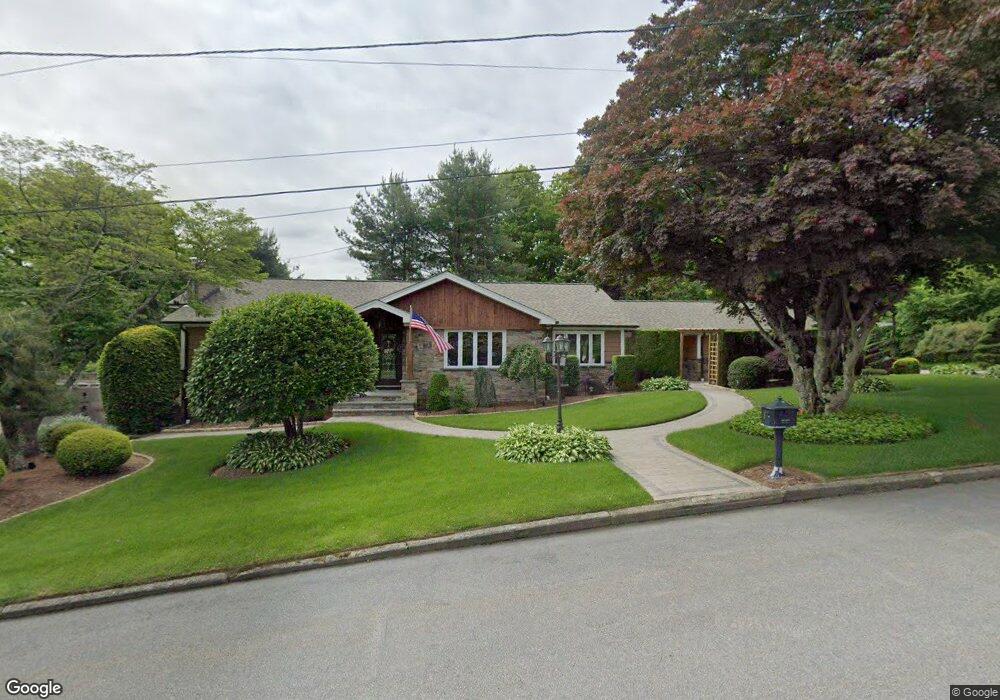
8 Brookwood Dr Johnston, RI 02919
Thornton NeighborhoodEstimated Value: $485,000 - $755,000
3
Beds
3
Baths
2,372
Sq Ft
$243/Sq Ft
Est. Value
About This Home
This home is located at 8 Brookwood Dr, Johnston, RI 02919 and is currently estimated at $577,299, approximately $243 per square foot. 8 Brookwood Dr is a home located in Providence County with nearby schools including Mazomanie Elementary School, Johnston Senior High School, and St Rocco School.
Ownership History
Date
Name
Owned For
Owner Type
Purchase Details
Closed on
Nov 19, 2013
Sold by
Dimauro John T and Dimauro Lisa M
Bought by
John T Dimauro Rt and Lisa M Dimauro Rt
Current Estimated Value
Home Financials for this Owner
Home Financials are based on the most recent Mortgage that was taken out on this home.
Original Mortgage
$65,000
Outstanding Balance
$42,633
Interest Rate
4.36%
Estimated Equity
$534,666
Purchase Details
Closed on
Oct 11, 2013
Sold by
Dimauro John T and Dimauro Lisa M
Bought by
Dimauro John T and Dimauro Lisa M
Home Financials for this Owner
Home Financials are based on the most recent Mortgage that was taken out on this home.
Original Mortgage
$65,000
Outstanding Balance
$42,633
Interest Rate
4.36%
Estimated Equity
$534,666
Purchase Details
Closed on
Jul 25, 1997
Sold by
Paolantonio Emma A
Bought by
Dimauro John and Dimauro Lisa
Create a Home Valuation Report for This Property
The Home Valuation Report is an in-depth analysis detailing your home's value as well as a comparison with similar homes in the area
Home Values in the Area
Average Home Value in this Area
Purchase History
| Date | Buyer | Sale Price | Title Company |
|---|---|---|---|
| John T Dimauro Rt | -- | -- | |
| Dimauro John T | -- | -- | |
| Dimauro John | $110,000 | -- | |
| John T Dimauro Rt | -- | -- | |
| Dimauro John T | -- | -- | |
| Dimauro John | $110,000 | -- |
Source: Public Records
Mortgage History
| Date | Status | Borrower | Loan Amount |
|---|---|---|---|
| Open | Dimauro John | $65,000 | |
| Open | Dimauro John | $175,000 |
Source: Public Records
Tax History Compared to Growth
Tax History
| Year | Tax Paid | Tax Assessment Tax Assessment Total Assessment is a certain percentage of the fair market value that is determined by local assessors to be the total taxable value of land and additions on the property. | Land | Improvement |
|---|---|---|---|---|
| 2025 | $7,882 | $504,600 | $94,400 | $410,200 |
| 2024 | $7,720 | $504,600 | $94,400 | $410,200 |
| 2023 | $7,720 | $504,600 | $94,400 | $410,200 |
| 2022 | $5,345 | $287,500 | $72,500 | $215,000 |
| 2021 | $6,682 | $287,500 | $72,500 | $215,000 |
| 2018 | $6,554 | $238,400 | $56,900 | $181,500 |
| 2016 | $8,671 | $238,400 | $56,900 | $181,500 |
| 2015 | $6,911 | $238,400 | $59,500 | $178,900 |
| 2014 | $5,483 | $238,400 | $59,500 | $178,900 |
| 2013 | $6,854 | $238,400 | $59,500 | $178,900 |
Source: Public Records
Map
Nearby Homes