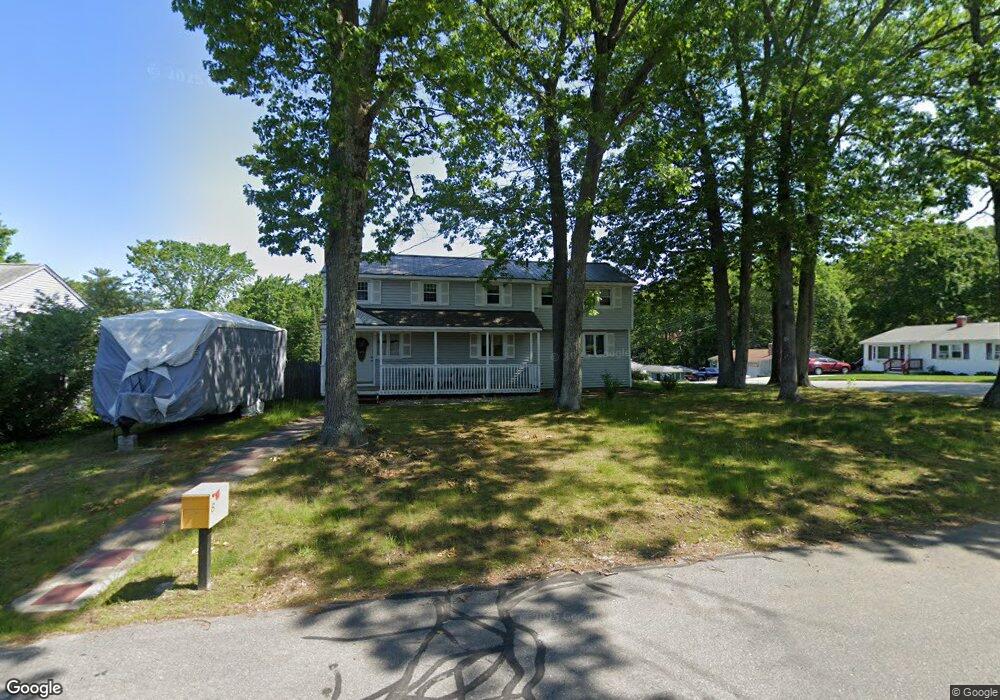
8 Bryant Rd Nashua, NH 03062
Southwest Nashua NeighborhoodEstimated Value: $526,574 - $587,000
2
Beds
2
Baths
1,832
Sq Ft
$305/Sq Ft
Est. Value
About This Home
This home is located at 8 Bryant Rd, Nashua, NH 03062 and is currently estimated at $559,644, approximately $305 per square foot. 8 Bryant Rd is a home located in Hillsborough County with nearby schools including Bicentennial Elementary School, Fairgrounds Middle School, and Nashua High School South.
Ownership History
Date
Name
Owned For
Owner Type
Purchase Details
Closed on
Sep 28, 2001
Sold by
Berard Louis E and Berard Christine M
Bought by
Morrow Christopher D and Morrow Lynn M
Current Estimated Value
Home Financials for this Owner
Home Financials are based on the most recent Mortgage that was taken out on this home.
Original Mortgage
$247,253
Interest Rate
6.91%
Mortgage Type
Purchase Money Mortgage
Purchase Details
Closed on
Mar 1, 1999
Sold by
Stdenis Marcella T
Bought by
Berard Louis E and Berard Christine M
Home Financials for this Owner
Home Financials are based on the most recent Mortgage that was taken out on this home.
Original Mortgage
$141,820
Interest Rate
6.78%
Mortgage Type
Purchase Money Mortgage
Create a Home Valuation Report for This Property
The Home Valuation Report is an in-depth analysis detailing your home's value as well as a comparison with similar homes in the area
Home Values in the Area
Average Home Value in this Area
Purchase History
| Date | Buyer | Sale Price | Title Company |
|---|---|---|---|
| Morrow Christopher D | $254,900 | -- | |
| Berard Louis E | $143,000 | -- |
Source: Public Records
Mortgage History
| Date | Status | Borrower | Loan Amount |
|---|---|---|---|
| Open | Berard Louis E | $225,800 | |
| Closed | Berard Louis E | $247,253 | |
| Previous Owner | Berard Louis E | $141,820 |
Source: Public Records
Tax History Compared to Growth
Tax History
| Year | Tax Paid | Tax Assessment Tax Assessment Total Assessment is a certain percentage of the fair market value that is determined by local assessors to be the total taxable value of land and additions on the property. | Land | Improvement |
|---|---|---|---|---|
| 2024 | $7,269 | $457,200 | $168,000 | $289,200 |
| 2023 | $6,838 | $375,100 | $134,500 | $240,600 |
| 2022 | $6,778 | $375,100 | $134,500 | $240,600 |
| 2021 | $6,441 | $277,400 | $98,600 | $178,800 |
| 2020 | $5,980 | $264,500 | $98,600 | $165,900 |
| 2019 | $5,756 | $264,500 | $98,600 | $165,900 |
| 2018 | $5,646 | $266,200 | $98,600 | $167,600 |
| 2017 | $5,916 | $229,400 | $85,000 | $144,400 |
| 2016 | $5,751 | $229,400 | $85,000 | $144,400 |
| 2015 | $5,627 | $229,400 | $85,000 | $144,400 |
| 2014 | $5,517 | $229,400 | $85,000 | $144,400 |
Source: Public Records
Map
Nearby Homes