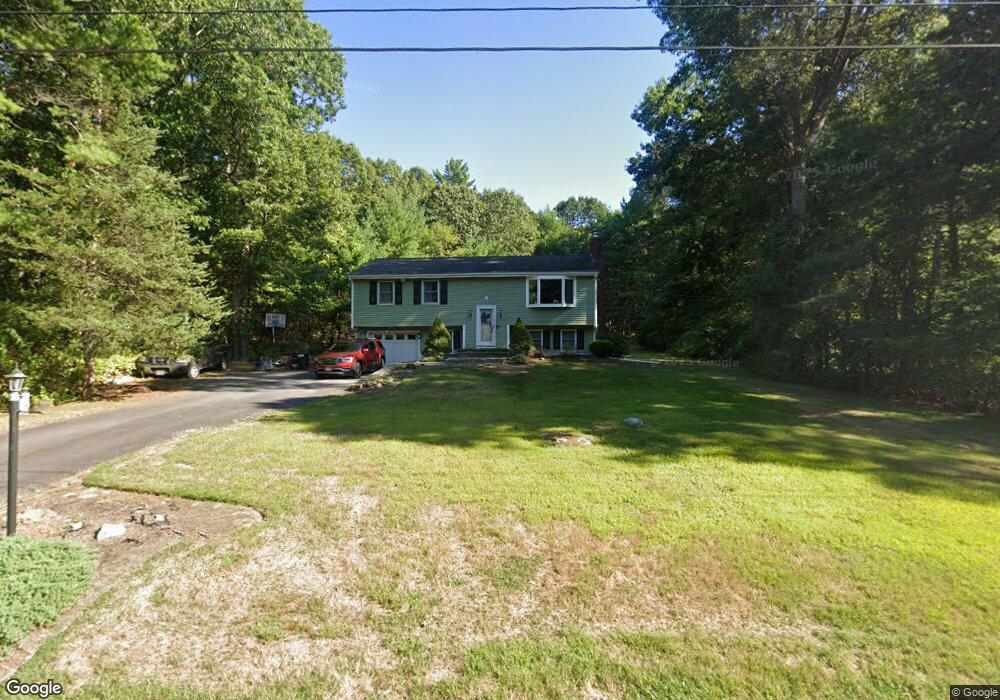
8 C h Clark Dr Assonet, MA 02702
Estimated Value: $483,000 - $555,000
4
Beds
1
Bath
1,250
Sq Ft
$409/Sq Ft
Est. Value
About This Home
This home is located at 8 C h Clark Dr, Assonet, MA 02702 and is currently estimated at $510,954, approximately $408 per square foot. 8 C h Clark Dr is a home located in Bristol County with nearby schools including Freetown Elementary School, George R Austin Intermediate School, and Freetown-Lakeville Middle School.
Ownership History
Date
Name
Owned For
Owner Type
Purchase Details
Closed on
Nov 29, 2006
Sold by
Wald Katherine and Wald Seth
Bought by
Aguiar Paul J and Aguiar Paul
Current Estimated Value
Home Financials for this Owner
Home Financials are based on the most recent Mortgage that was taken out on this home.
Original Mortgage
$276,300
Outstanding Balance
$165,651
Interest Rate
6.36%
Mortgage Type
Purchase Money Mortgage
Estimated Equity
$345,303
Purchase Details
Closed on
Jul 16, 2002
Sold by
Hereoux Michael A and Hereoux Susan J
Bought by
Wald Katherine and Wald Seth
Home Financials for this Owner
Home Financials are based on the most recent Mortgage that was taken out on this home.
Original Mortgage
$187,200
Interest Rate
6.79%
Mortgage Type
Purchase Money Mortgage
Purchase Details
Closed on
Oct 9, 1996
Sold by
Reynolds Eileen S
Bought by
Heroux Susan J
Create a Home Valuation Report for This Property
The Home Valuation Report is an in-depth analysis detailing your home's value as well as a comparison with similar homes in the area
Home Values in the Area
Average Home Value in this Area
Purchase History
| Date | Buyer | Sale Price | Title Company |
|---|---|---|---|
| Aguiar Paul J | $307,000 | -- | |
| Wald Katherine | $234,000 | -- | |
| Heroux Susan J | $125,000 | -- |
Source: Public Records
Mortgage History
| Date | Status | Borrower | Loan Amount |
|---|---|---|---|
| Open | Aguiar Paul J | $276,300 | |
| Previous Owner | Heroux Susan J | $238,000 | |
| Previous Owner | Heroux Susan J | $187,200 |
Source: Public Records
Tax History Compared to Growth
Tax History
| Year | Tax Paid | Tax Assessment Tax Assessment Total Assessment is a certain percentage of the fair market value that is determined by local assessors to be the total taxable value of land and additions on the property. | Land | Improvement |
|---|---|---|---|---|
| 2025 | $4,312 | $435,100 | $179,300 | $255,800 |
| 2024 | $4,284 | $410,700 | $169,200 | $241,500 |
| 2023 | $4,144 | $386,900 | $152,400 | $234,500 |
| 2022 | $3,977 | $329,800 | $129,100 | $200,700 |
| 2021 | $3,811 | $300,100 | $117,400 | $182,700 |
| 2020 | $3,768 | $289,400 | $112,900 | $176,500 |
| 2019 | $3,590 | $273,000 | $107,500 | $165,500 |
| 2018 | $3,401 | $255,500 | $107,500 | $148,000 |
| 2017 | $3,310 | $248,500 | $107,500 | $141,000 |
| 2016 | $3,059 | $233,700 | $104,400 | $129,300 |
| 2015 | $2,982 | $231,200 | $104,400 | $126,800 |
| 2014 | $2,786 | $220,900 | $102,200 | $118,700 |
Source: Public Records
Map
Nearby Homes