Estimated Value: $279,000 - $327,000
3
Beds
2
Baths
1,344
Sq Ft
$219/Sq Ft
Est. Value
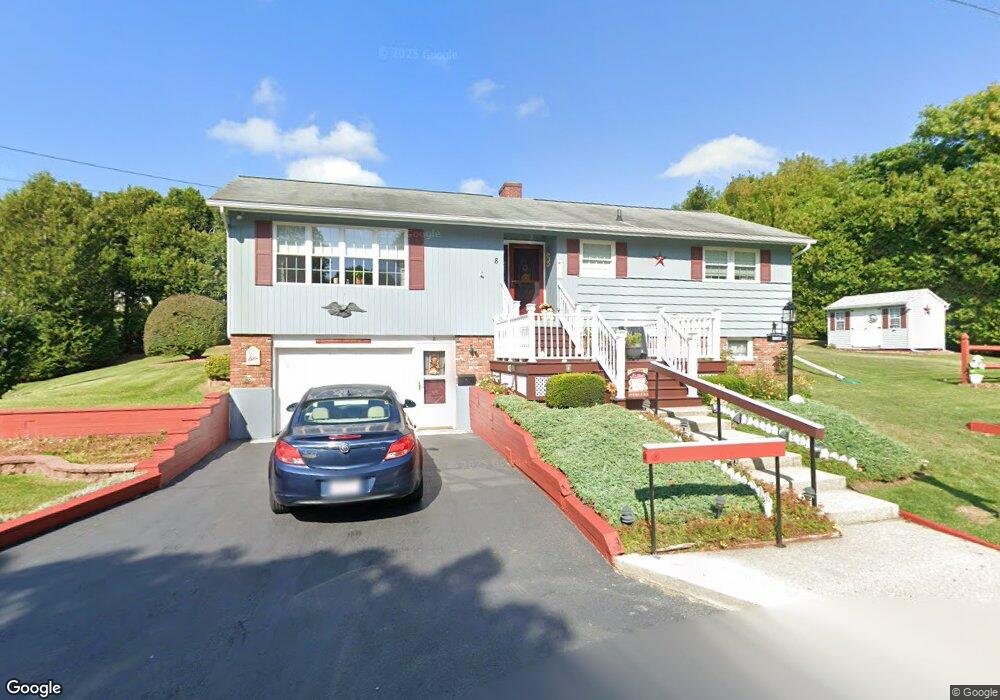
About This Home
This home is located at 8 Cedar Ln, Adams, MA 01220 and is currently estimated at $293,878, approximately $218 per square foot. 8 Cedar Ln is a home located in Berkshire County with nearby schools including Hoosac Valley Middle & High School, Berkshire Arts & Technology Charter Public School, and St. Stanislaus Kostka School.
Ownership History
Date
Name
Owned For
Owner Type
Purchase Details
Closed on
Dec 13, 2012
Sold by
Baker Starr D and Baker Patricia A
Bought by
Ostrander Debra
Current Estimated Value
Home Financials for this Owner
Home Financials are based on the most recent Mortgage that was taken out on this home.
Original Mortgage
$40,000
Outstanding Balance
$27,784
Interest Rate
3.5%
Mortgage Type
Adjustable Rate Mortgage/ARM
Estimated Equity
$266,094
Purchase Details
Closed on
Jun 8, 1964
Bought by
Baker Starr D and Baker Patricia A
Create a Home Valuation Report for This Property
The Home Valuation Report is an in-depth analysis detailing your home's value as well as a comparison with similar homes in the area
Home Values in the Area
Average Home Value in this Area
Purchase History
| Date | Buyer | Sale Price | Title Company |
|---|---|---|---|
| Ostrander Debra | -- | -- | |
| Baker Starr D | -- | -- |
Source: Public Records
Mortgage History
| Date | Status | Borrower | Loan Amount |
|---|---|---|---|
| Open | Baker Starr D | $40,000 | |
| Previous Owner | Baker Starr D | $40,000 | |
| Previous Owner | Baker Starr D | $25,000 |
Source: Public Records
Tax History
| Year | Tax Paid | Tax Assessment Tax Assessment Total Assessment is a certain percentage of the fair market value that is determined by local assessors to be the total taxable value of land and additions on the property. | Land | Improvement |
|---|---|---|---|---|
| 2025 | $3,938 | $231,500 | $54,800 | $176,700 |
| 2024 | $3,713 | $211,700 | $51,500 | $160,200 |
| 2023 | $3,456 | $186,300 | $46,800 | $139,500 |
| 2022 | $3,367 | $161,200 | $40,700 | $120,500 |
| 2021 | $3,655 | $145,800 | $40,700 | $105,100 |
| 2020 | $3,453 | $146,100 | $41,300 | $104,800 |
| 2019 | $3,115 | $146,100 | $41,300 | $104,800 |
| 2018 | $3,203 | $144,200 | $41,300 | $102,900 |
| 2017 | $3,251 | $144,200 | $41,300 | $102,900 |
| 2016 | $2,948 | $137,800 | $41,300 | $96,500 |
| 2015 | $2,883 | $134,900 | $43,100 | $91,800 |
| 2014 | $2,691 | $134,900 | $43,100 | $91,800 |
Source: Public Records
Map
Nearby Homes
Your Personal Tour Guide
Ask me questions while you tour the home.