Estimated Value: $1,294,000 - $1,652,000
2
Beds
3
Baths
2,802
Sq Ft
$515/Sq Ft
Est. Value
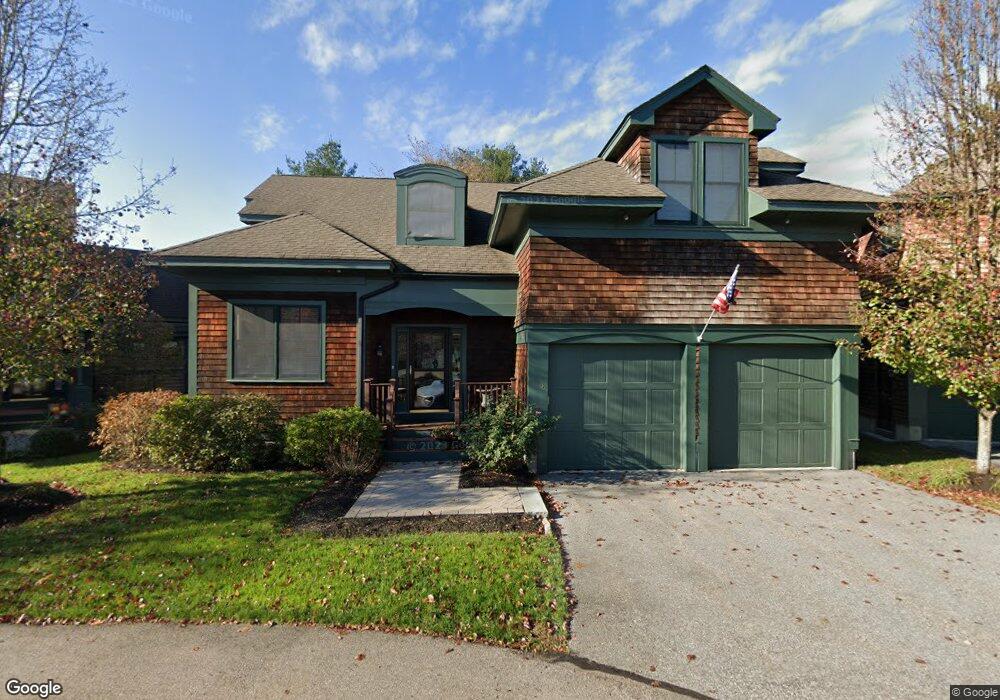
About This Home
This home is located at 8 Clover Cir, Dover, MA 02030 and is currently estimated at $1,442,242, approximately $514 per square foot. 8 Clover Cir is a home located in Norfolk County with nearby schools including Chickering Elementary School, Dover-Sherborn Regional Middle School, and Dover-Sherborn Regional High School.
Ownership History
Date
Name
Owned For
Owner Type
Purchase Details
Closed on
Jun 13, 2016
Sold by
Dixon Robert F and Dixon Kristen A
Bought by
Clover 8 Rt
Current Estimated Value
Purchase Details
Closed on
Jul 11, 2013
Sold by
Est Abelow Allan V and Abelow David S
Bought by
Dixon Robert F and Dixon Kristen A
Home Financials for this Owner
Home Financials are based on the most recent Mortgage that was taken out on this home.
Original Mortgage
$300,000
Interest Rate
3.83%
Mortgage Type
New Conventional
Purchase Details
Closed on
Aug 31, 2010
Sold by
20 Springdale Ave Llc
Bought by
Abelow Allan
Home Financials for this Owner
Home Financials are based on the most recent Mortgage that was taken out on this home.
Original Mortgage
$523,750
Interest Rate
4.57%
Mortgage Type
Purchase Money Mortgage
Create a Home Valuation Report for This Property
The Home Valuation Report is an in-depth analysis detailing your home's value as well as a comparison with similar homes in the area
Home Values in the Area
Average Home Value in this Area
Purchase History
| Date | Buyer | Sale Price | Title Company |
|---|---|---|---|
| Clover 8 Rt | -- | -- | |
| Dixon Robert F | $750,000 | -- | |
| Abelow Allan | $825,000 | -- |
Source: Public Records
Mortgage History
| Date | Status | Borrower | Loan Amount |
|---|---|---|---|
| Previous Owner | Dixon Robert F | $300,000 | |
| Previous Owner | Abelow Allan | $523,750 |
Source: Public Records
Tax History
| Year | Tax Paid | Tax Assessment Tax Assessment Total Assessment is a certain percentage of the fair market value that is determined by local assessors to be the total taxable value of land and additions on the property. | Land | Improvement |
|---|---|---|---|---|
| 2025 | $13,712 | $1,216,700 | $0 | $1,216,700 |
| 2024 | $13,335 | $1,216,700 | $0 | $1,216,700 |
| 2023 | $14,551 | $1,193,700 | $0 | $1,193,700 |
| 2022 | $10,958 | $882,300 | $0 | $882,300 |
| 2021 | $11,373 | $882,300 | $0 | $882,300 |
| 2020 | $11,128 | $866,700 | $0 | $866,700 |
| 2019 | $11,206 | $866,700 | $0 | $866,700 |
| 2018 | $10,651 | $829,500 | $0 | $829,500 |
| 2017 | $9,850 | $754,800 | $0 | $754,800 |
| 2016 | $9,722 | $754,800 | $0 | $754,800 |
| 2015 | $9,586 | $754,800 | $0 | $754,800 |
Source: Public Records
Map
Nearby Homes
- 8 Clover Cir
- 10 Clover Cir
- 6 Clover Cir
- 4 Clover Cir
- 9 Clover Cir
- 9 Clover Cir
- 5 Clover Cir
- 7 Clover Cir
- 12 Hawthorne Ln
- 12 Hawthorne Ln Unit 12
- 3 Clover Cir Unit 3
- 3 Clover Cir
- 3 Clover Cir
- 2 Clover Cir
- 1 Hawthorne Ln Unit 2
- 1 Hawthorne Ln
- 1 Clover Cir
- 13 Hawthorne Ln
- 3 Hawthorne Ln
- 17 Hawthorne Ln
Your Personal Tour Guide
Ask me questions while you tour the home.