NOT LISTED FOR SALE

8 Covered Bridge Acres Glenarm, IL 62536

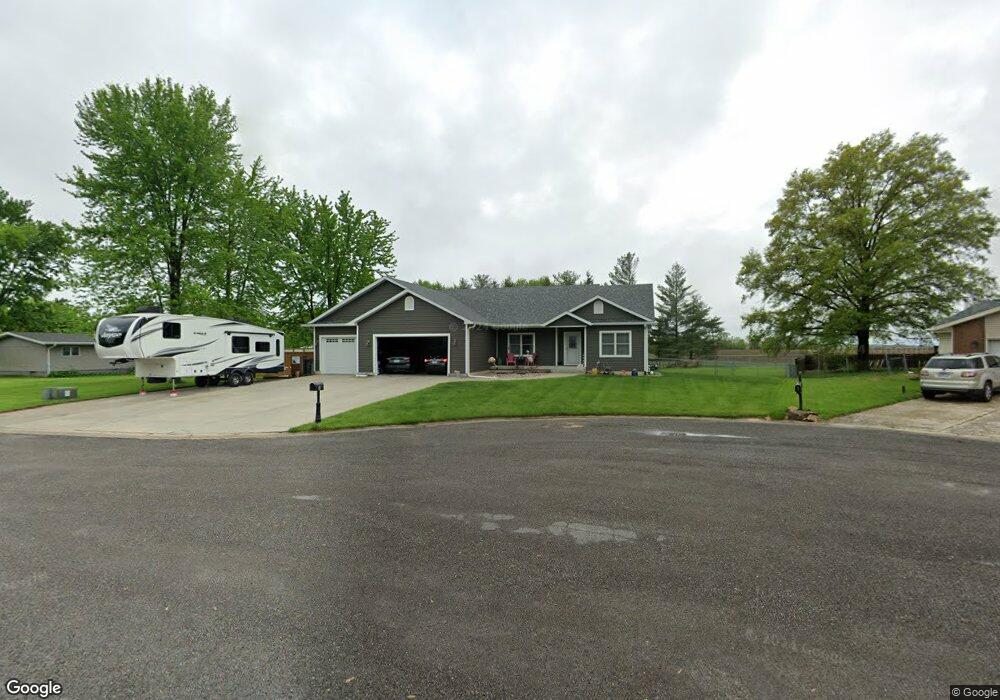
Estimated Value: $261,000 - $269,000

0.62 Acre
$428,110 Price per Acre
26,964 Sq Ft Lot

Last Sold April 19, 2016

Last sale price $22,000

Est. 1,105% increase in value since last sale

Current estimated payment $1,896/month

About This Lot

As of April 2016

Vacant land

Last Agent to Sell the Property

Eric Pedigo

The Real Estate Group, Inc. License #475159677 Listed on: 04/06/2016

The Real Estate Group, Inc.

Last Buyer's Agent

Eric Pedigo

The Real Estate Group, Inc. License #475159677 Listed on: 04/06/2016

The Real Estate Group, Inc.

Property Details

Property Type

  • Land

Est. Annual Taxes

  • $446

Lot Details

Schools

  • Chatham District #5 High School

Property Details

Property Type

Land

Est. Annual Taxes

$446

Lot Details

0

Listing Details

  • Class: Lots/Acres/Farms
  • Type: Lots
  • Legal Description: L 8 COVERED BRIDGE ACRES 28-14-5 PLAT 1
  • Special Features: None
  • Property Sub Type: LotsLands

Utilities

  • Water Sewer: Public Sewer
  • Utilities Available: Electricity/Lot Line

Schools

  • High School: Chatham District #5
  • High School: Chatham District #5

Lot Info

  • Estimated Lot Size: 98x214x117x60x165
  • Zoning: Residential
  • Estimated Number Tillable Acres: 2
  • Subdivision: Covered Bridge Acres
  • Geo Subdivision: IL

Tax Info

  • Annual Taxes: 446
  • Parcel Id Number Tax Id: 29280102007
  • Tax Year: 2014

Ownership History

Date Name Owned For Owner Type

Purchase Details

Closed on
Jun 4, 2014
Current Estimated Value
$265,000
Source: Public Records

Range of Values:

Collateral Analytics

Collateral Analytics Collateral Analytics AVMs (Automated Valuation Model) employ a number of statistical approaches combined with neighborhood-specific comparable selection guarantees the most up-to-date and precise valuations.

Not Available

Collateral Analytics does not have data for the current month. Please view the chart for historical values.

ICE

ICE Mortgage Technology ICE Mortgage Technology’s AVM (Automated Valuation Model) is a state-of-the-art online residential property valuation tool that provides a quick and accurate estimate of the value of almost any home in the U.S.

Not Available

ICE Mortgage Technology does not have data for the current month. Please view the chart for historical values.

First American

First American First American Data & Analytics’ next-generation AVM combines unrivaled data assets with a blended ensemble of valuation models to produce highly accurate, reliable valuations you can trust.

Not Available

First American does not have data for the current month. Please view the chart for historical values.

Quantarium

Quantarium Quantarium’s valuation service, repeatedly proven the industry’s most accurate and comprehensive, is supercharged with a self-learning and auto-tuning AI engine that continually becomes smarter and more accurate as it processes daily inputs from the industry’s leading RE data lake.

Not Available

Quantarium does not have data for the current month. Please view the chart for historical values.

Average Value
Not Available
List Price
Sold Price
Create a Home Valuation Report for This Property
The Home Valuation Report is an in-depth analysis detailing your home's value as well as a comparison with similar homes in the area

Home Values in the Area

Source: Public Records

Average Home Value in this Area


Source: Public Records

Purchase History

Date Buyer Sale Price Title Company
-- $18,000 --
Source: Public Records

Property History

Date Event Price List to Sale Price per Sq Ft
04/19/2016 04/19/16 Sold $22,000 -11.6% --
04/06/2016 04/06/16 For Sale $24,900 -- --
Source: RMLS Alliance

Tax History Compared to Growth

Source: Public Records

Tax History

Year Tax Paid Tax Assessment Tax Assessment Total Assessment is a certain percentage of the fair market value that is determined by local assessors to be the total taxable value of land and additions on the property. Land Improvement
2024 $5,818 $99,379 $9,014 $90,365
2023 $5,450 $90,058 $8,169 $81,889
2022 $5,142 $84,009 $7,620 $76,389
2021 $4,889 $79,780 $7,236 $72,544
2020 $4,770 $78,269 $7,099 $71,170
2019 $4,583 $76,794 $6,965 $69,829
2018 $4,497 $76,817 $6,967 $69,850
2017 $3,428 $59,499 $6,967 $52,532
2016 $465 $6,891 $6,891 $0
2015 $458 $6,688 $6,688 $0
2014 $446 $6,479 $6,479 $0
2013 $431 $6,287 $6,287 $0
Source: Public Records

Agents Affiliated with this Home

  • Section Image
See All Agents

Map

Source: RMLS Alliance

MLS Number: RMACA161944

RMLS Alliance

APN: 29-28.0-102-007