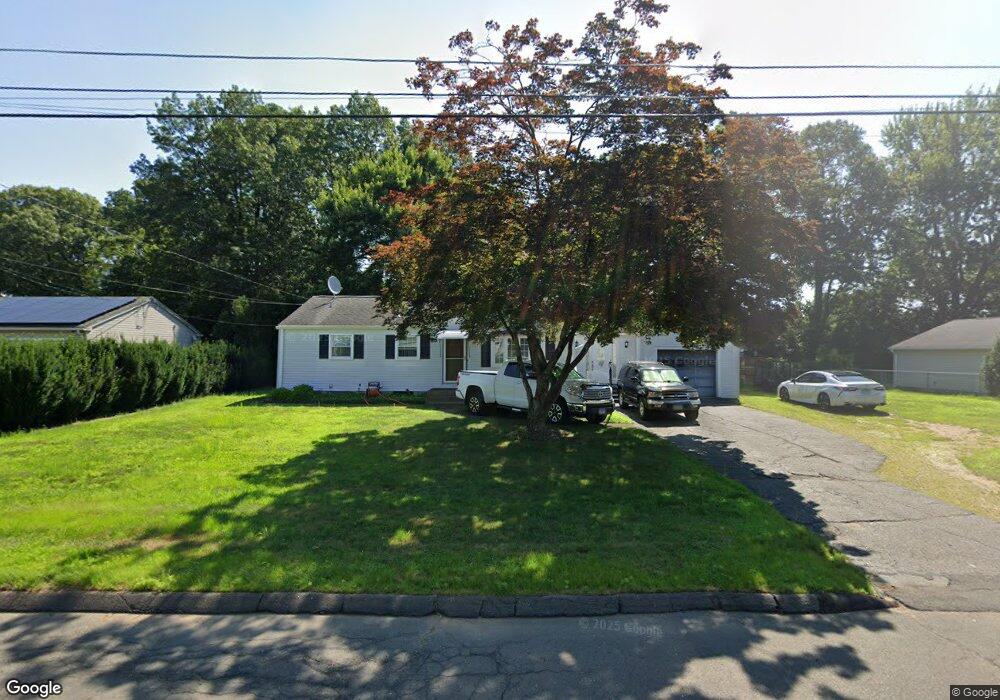
8 Creston Rd Windsor Locks, CT 06096
Estimated Value: $285,000 - $327,000
About This Home
This home is located at 8 Creston Rd, Windsor Locks, CT 06096 and is currently estimated at $309,720, approximately $309 per square foot. 8 Creston Rd is a home located in Hartford County with nearby schools including North Street School, South Elementary School, and Windsor Locks Middle School.
Ownership History
We collect this data history from publicly available records. To have your information removed, we recommend requesting removal directly through your county’s website.
Purchase Details
Home Values in the Area
Average Home Value in this Area
Purchase History
We collect this data history from publicly available records. To have your information removed, we recommend requesting removal directly through your county’s website.
| Date | Buyer | Sale Price | Title Company |
|---|---|---|---|
| $41,500 | -- | ||
| $41,500 | -- |
Tax History
We collect this data history from publicly available records. To have your information removed, we recommend requesting removal directly through your county’s website.
| Year | Tax Paid | Tax Assessment Tax Assessment Total Assessment is a certain percentage of the fair market value that is determined by local assessors to be the total taxable value of land and additions on the property. | Land | Improvement |
|---|---|---|---|---|
| 2025 | $4,771 | $198,870 | $58,030 | $140,840 |
| 2024 | $3,315 | $117,810 | $45,220 | $72,590 |
| 2023 | $3,102 | $117,810 | $45,220 | $72,590 |
| 2022 | $3,043 | $117,810 | $45,220 | $72,590 |
| 2021 | $3,043 | $117,810 | $45,220 | $72,590 |
| 2020 | $3,043 | $117,810 | $45,220 | $72,590 |
| 2019 | $3,043 | $117,810 | $45,220 | $72,590 |
| 2017 | $2,725 | $102,200 | $44,900 | $57,300 |
| 2016 | $2,725 | $102,200 | $44,900 | $57,300 |
| 2015 | $2,738 | $102,200 | $44,900 | $57,300 |
| 2014 | $3,148 | $120,000 | $51,000 | $69,000 |
Map
- 33 Thomas St
- 433 Reed Ave
- 19 Alberta St
- 443 North St
- 202 Reed Ave
- 20 Partridge Ct Unit 20
- 50 Chapman Chase Unit 50
- 66 Woodcock Ct Unit 66
- 39 Chapman Chase
- 31 Ross Way Unit 31
- 25 Meg Way
- 141 Elm St
- 10 Center St
- 134 Sunset St
- 63 Darien Dr
- 15 Suffield St
- 416 Litchfield Dr
- 74 Main St Unit C3
- 20 Miller Terrace
- 8 Concorde Way Unit B5
Ask me questions while you tour the home.