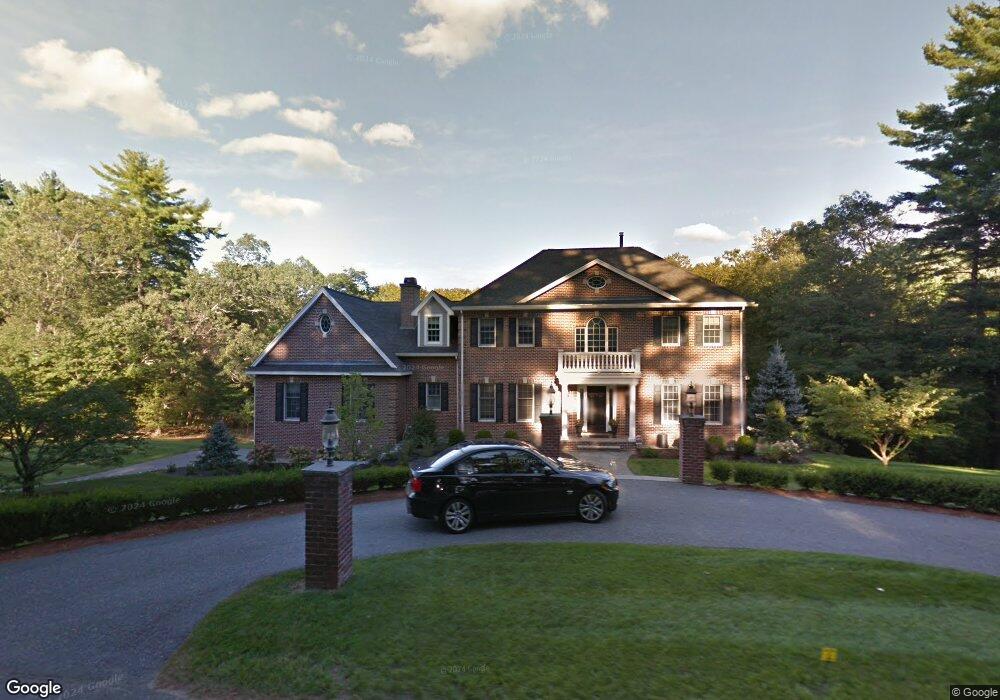
8 Cullen Cir Andover, MA 01810
Estimated Value: $1,628,000 - $2,153,000
4
Beds
4
Baths
4,227
Sq Ft
$421/Sq Ft
Est. Value
About This Home
This home is located at 8 Cullen Cir, Andover, MA 01810 and is currently estimated at $1,778,853, approximately $420 per square foot. 8 Cullen Cir is a home located in Essex County with nearby schools including South Elementary School, Doherty Middle School, and Andover High School.
Ownership History
Date
Name
Owned For
Owner Type
Purchase Details
Closed on
Dec 1, 2010
Sold by
Mcdonnell John J and Mcdonnell Julie
Bought by
Thatcher Gentry W and Thatcher Melissa O
Current Estimated Value
Home Financials for this Owner
Home Financials are based on the most recent Mortgage that was taken out on this home.
Original Mortgage
$750,000
Outstanding Balance
$495,510
Interest Rate
4.22%
Mortgage Type
Purchase Money Mortgage
Estimated Equity
$1,283,343
Purchase Details
Closed on
May 30, 2002
Sold by
Mcdonnell John J and Mcdonnell Julie
Bought by
Farrell Daniel C and Farrell Sue A
Create a Home Valuation Report for This Property
The Home Valuation Report is an in-depth analysis detailing your home's value as well as a comparison with similar homes in the area
Purchase History
| Date | Buyer | Sale Price | Title Company |
|---|---|---|---|
| Thatcher Gentry W | $1,137,500 | -- | |
| Farrell Daniel C | $807,500 | -- |
Source: Public Records
Mortgage History
| Date | Status | Borrower | Loan Amount |
|---|---|---|---|
| Open | Thatcher Gentry W | $750,000 |
Source: Public Records
Tax History
| Year | Tax Paid | Tax Assessment Tax Assessment Total Assessment is a certain percentage of the fair market value that is determined by local assessors to be the total taxable value of land and additions on the property. | Land | Improvement |
|---|---|---|---|---|
| 2024 | $19,328 | $1,500,600 | $534,900 | $965,700 |
| 2023 | $18,202 | $1,332,500 | $457,800 | $874,700 |
| 2022 | $17,428 | $1,193,700 | $413,000 | $780,700 |
| 2021 | $16,752 | $1,095,600 | $375,900 | $719,700 |
| 2020 | $16,265 | $1,083,600 | $375,900 | $707,700 |
| 2019 | $16,047 | $1,050,900 | $355,000 | $695,900 |
| 2018 | $15,449 | $987,800 | $345,000 | $642,800 |
| 2017 | $14,863 | $979,100 | $338,500 | $640,600 |
| 2016 | $14,820 | $1,000,000 | $355,900 | $644,100 |
| 2015 | $14,455 | $965,600 | $355,900 | $609,700 |
Source: Public Records
Map
Nearby Homes
Your Personal Tour Guide
Ask me questions while you tour the home.