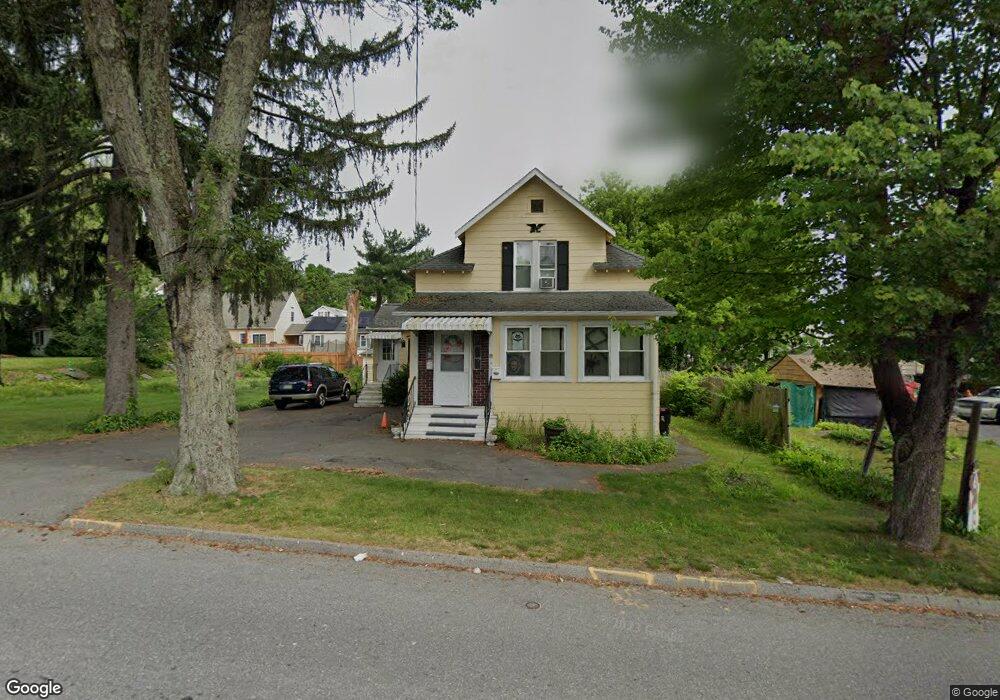
8 Dalton St Unit 1 Worcester, MA 01604
Grafton Hill NeighborhoodEstimated Value: $374,000 - $380,000
3
Beds
1
Bath
1,300
Sq Ft
$290/Sq Ft
Est. Value
About This Home
This home is located at 8 Dalton St Unit 1, Worcester, MA 01604 and is currently estimated at $376,392, approximately $289 per square foot. 8 Dalton St Unit 1 is a home located in Worcester County with nearby schools including Roosevelt Elementary School, Jacob Hiatt Magnet School, and Chandler Magnet.
Ownership History
Date
Name
Owned For
Owner Type
Purchase Details
Closed on
Oct 15, 2025
Sold by
Oneil Dennis E and Oneil Nicole M
Bought by
K Properties Llc
Current Estimated Value
Home Financials for this Owner
Home Financials are based on the most recent Mortgage that was taken out on this home.
Original Mortgage
$300,000
Outstanding Balance
$299,729
Interest Rate
6.5%
Mortgage Type
Commercial
Estimated Equity
$76,663
Purchase Details
Closed on
Jan 23, 2023
Sold by
Oneil Dennis E and Oneil Nicole M
Bought by
Oneil Dennis E and Oneil Nicole M
Home Financials for this Owner
Home Financials are based on the most recent Mortgage that was taken out on this home.
Original Mortgage
$185,000
Interest Rate
6.33%
Mortgage Type
New Conventional
Purchase Details
Closed on
Oct 30, 2017
Sold by
Rader Lt and Rader
Bought by
Oneil Dennis and Oneil Monica
Home Financials for this Owner
Home Financials are based on the most recent Mortgage that was taken out on this home.
Original Mortgage
$156,750
Interest Rate
3.78%
Mortgage Type
New Conventional
Purchase Details
Closed on
May 9, 2013
Sold by
Rader Alan J and Rader Paula
Bought by
Rader Lt and Rader
Create a Home Valuation Report for This Property
The Home Valuation Report is an in-depth analysis detailing your home's value as well as a comparison with similar homes in the area
Home Values in the Area
Average Home Value in this Area
Purchase History
| Date | Buyer | Sale Price | Title Company |
|---|---|---|---|
| K Properties Llc | $375,000 | -- | |
| Oneil Dennis E | -- | None Available | |
| Oneil Dennis E | -- | None Available | |
| Oneil Dennis | $209,000 | -- | |
| Rader Lt | -- | -- | |
| Rader Lt | -- | -- | |
| Rader Lt | -- | -- |
Source: Public Records
Mortgage History
| Date | Status | Borrower | Loan Amount |
|---|---|---|---|
| Open | K Properties Llc | $300,000 | |
| Previous Owner | Oneil Dennis E | $185,000 | |
| Previous Owner | Oneil Dennis | $156,750 |
Source: Public Records
Tax History Compared to Growth
Tax History
| Year | Tax Paid | Tax Assessment Tax Assessment Total Assessment is a certain percentage of the fair market value that is determined by local assessors to be the total taxable value of land and additions on the property. | Land | Improvement |
|---|---|---|---|---|
| 2025 | $4,074 | $308,900 | $118,700 | $190,200 |
| 2024 | $3,960 | $288,000 | $118,700 | $169,300 |
| 2023 | $3,786 | $264,000 | $103,200 | $160,800 |
| 2022 | $3,471 | $228,200 | $82,600 | $145,600 |
| 2021 | $3,280 | $201,500 | $66,100 | $135,400 |
| 2020 | $3,176 | $186,800 | $66,100 | $120,700 |
| 2019 | $3,064 | $170,200 | $59,500 | $110,700 |
| 2018 | $3,088 | $163,300 | $59,500 | $103,800 |
| 2017 | $0 | $150,900 | $59,500 | $91,400 |
| 2016 | -- | $134,600 | $43,700 | $90,900 |
| 2015 | -- | $134,600 | $43,700 | $90,900 |
| 2014 | -- | $134,600 | $43,700 | $90,900 |
Source: Public Records
Map
Nearby Homes
- 63 Progressive St
- 61 Progressive St
- 270 Sunderland Rd Unit 37
- 270 Sunderland Rd Unit 73
- 11 Phoenix St
- 330 Sunderland Rd Unit 87
- 25 Stoneham Rd
- 53 Denver Terrace
- 11 Benson St
- 259 Massasoit Rd
- 7 Atlas St
- 266 Massasoit Rd
- 119 Orton Street Extension
- 1195 Grafton St Unit 39
- 1201 Grafton St Unit 73
- 21 Middlesex Ave Unit 102
- 62 Allston Ave
- 46 Vincent Cir
- 15 Anderson Ave
- 91 Standish St