8 Darling St Worcester, MA 01605
North Lincoln Street NeighborhoodEstimated Value: $465,421 - $541,000
4
Beds
2
Baths
1,809
Sq Ft
$277/Sq Ft
Est. Value
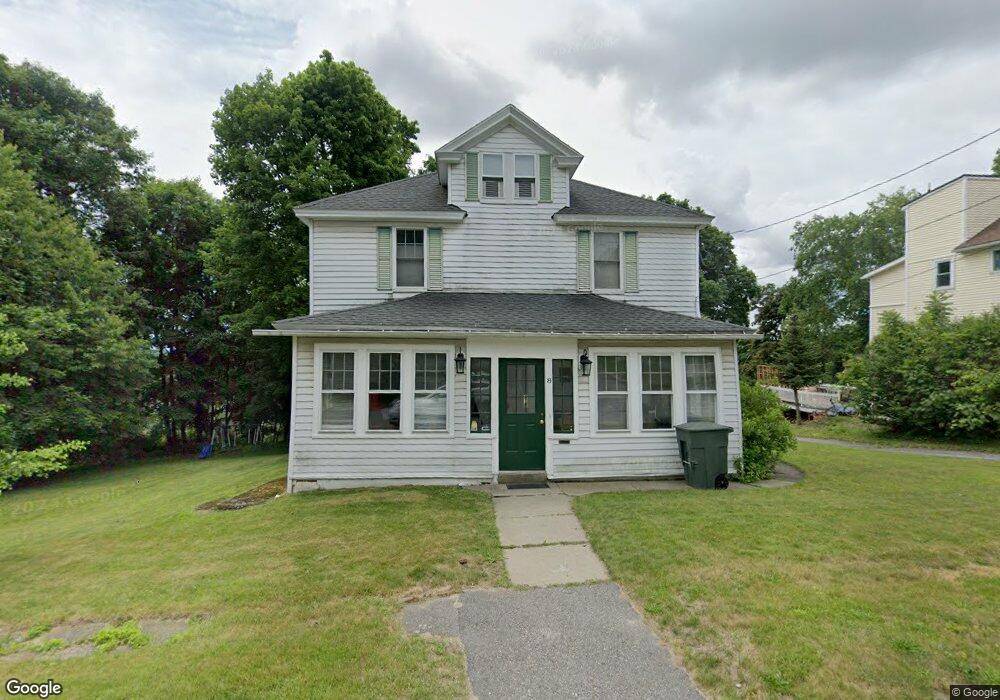
About This Home
This home is located at 8 Darling St, Worcester, MA 01605 and is currently estimated at $501,855, approximately $277 per square foot. 8 Darling St is a home located in Worcester County with nearby schools including Jacob Hiatt Magnet School, Chandler Magnet, and Thorndyke Road School.
Ownership History
Date
Name
Owned For
Owner Type
Purchase Details
Closed on
Nov 27, 1990
Sold by
Shrewsbury Southgate
Bought by
Breault Richard R
Current Estimated Value
Home Financials for this Owner
Home Financials are based on the most recent Mortgage that was taken out on this home.
Original Mortgage
$112,000
Interest Rate
10.19%
Mortgage Type
Purchase Money Mortgage
Purchase Details
Closed on
Jun 15, 1990
Sold by
Long Stina B
Bought by
Shrewsbury Southgate
Create a Home Valuation Report for This Property
The Home Valuation Report is an in-depth analysis detailing your home's value as well as a comparison with similar homes in the area
Home Values in the Area
Average Home Value in this Area
Purchase History
| Date | Buyer | Sale Price | Title Company |
|---|---|---|---|
| Breault Richard R | $120,000 | -- | |
| Shrewsbury Southgate | $123,300 | -- |
Source: Public Records
Mortgage History
| Date | Status | Borrower | Loan Amount |
|---|---|---|---|
| Closed | Shrewsbury Southgate | $112,000 |
Source: Public Records
Tax History Compared to Growth
Tax History
| Year | Tax Paid | Tax Assessment Tax Assessment Total Assessment is a certain percentage of the fair market value that is determined by local assessors to be the total taxable value of land and additions on the property. | Land | Improvement |
|---|---|---|---|---|
| 2025 | $5,141 | $389,800 | $118,900 | $270,900 |
| 2024 | $4,935 | $358,900 | $118,900 | $240,000 |
| 2023 | $4,742 | $330,700 | $103,400 | $227,300 |
| 2022 | $4,373 | $287,500 | $82,700 | $204,800 |
| 2021 | $4,365 | $268,100 | $66,200 | $201,900 |
| 2020 | $4,163 | $244,900 | $66,200 | $178,700 |
| 2019 | $4,007 | $222,600 | $59,600 | $163,000 |
| 2018 | $4,005 | $211,800 | $59,600 | $152,200 |
| 2017 | $3,840 | $199,800 | $59,600 | $140,200 |
| 2016 | $3,823 | $185,500 | $44,100 | $141,400 |
| 2015 | $3,723 | $185,500 | $44,100 | $141,400 |
| 2014 | $3,625 | $185,500 | $44,100 | $141,400 |
Source: Public Records
Map
Nearby Homes
- 23 Viele Ave
- 29 Tylee Ave
- 8 Cherry Blossom Cir Unit 50
- 21 Trinity Ave
- 36 Melrose St
- 276 Saint Nicholas Ave
- 3 Huron Ave
- 37 Kenwood Ave
- 57 Pasadena Pkwy
- 3 Selden St
- 2 Selden St
- 9 Green Hill Ave
- 48 Wilkinson St
- 80 Clark St
- 3 Granville Ave
- 10 Boylston St
- 314 Burncoat St
- 15 Ericsson St
- 14 Housatonic St
- 131 Airlie St