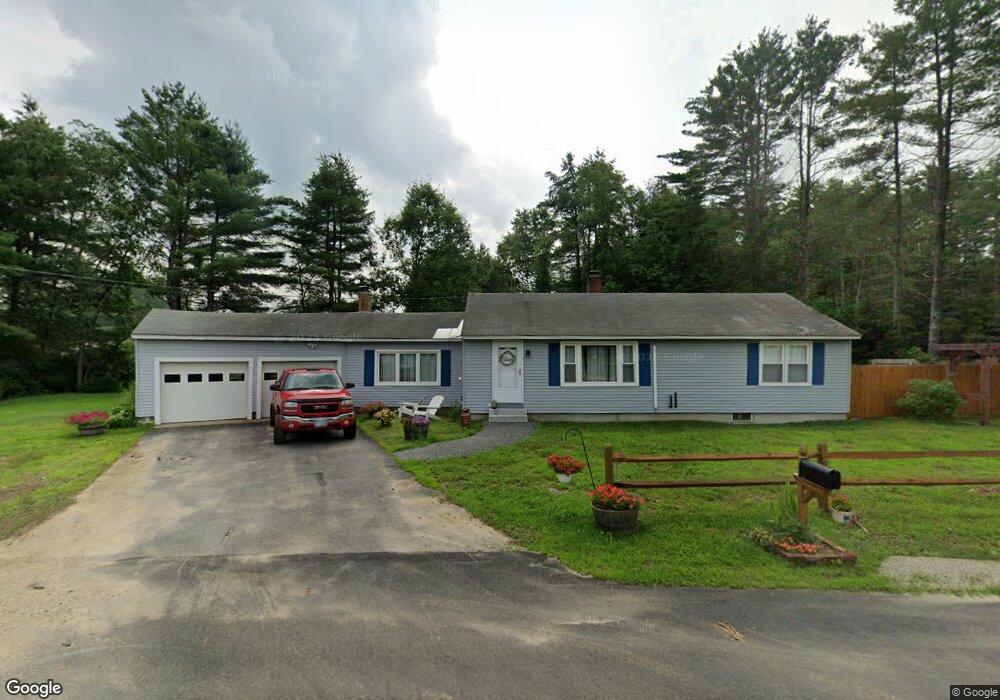
8 Davis Ave Swanzey, NH 03446
Estimated Value: $333,000 - $400,000
3
Beds
2
Baths
1,474
Sq Ft
$247/Sq Ft
Est. Value
About This Home
This home is located at 8 Davis Ave, Swanzey, NH 03446 and is currently estimated at $364,461, approximately $247 per square foot. 8 Davis Ave is a home located in Cheshire County with nearby schools including Mt. Caesar Elementary School, Cutler School, and Monadnock Regional High School.
Ownership History
Date
Name
Owned For
Owner Type
Purchase Details
Closed on
Jul 6, 2023
Sold by
Seymour Brennen S
Bought by
Deem Alyssa L
Current Estimated Value
Home Financials for this Owner
Home Financials are based on the most recent Mortgage that was taken out on this home.
Original Mortgage
$189,500
Outstanding Balance
$184,598
Interest Rate
6.35%
Mortgage Type
Stand Alone Refi Refinance Of Original Loan
Estimated Equity
$179,863
Purchase Details
Closed on
Oct 12, 2018
Sold by
Weinrieb 2012 Ft and Weinrich
Bought by
Deem Alyssa L and Seymour Brenna S
Home Financials for this Owner
Home Financials are based on the most recent Mortgage that was taken out on this home.
Original Mortgage
$141,414
Interest Rate
4.5%
Mortgage Type
New Conventional
Purchase Details
Closed on
Sep 19, 2012
Sold by
Weinrich Jerome J and Weinrieb Rose
Bought by
Weinrieb Ft and Weinrieb
Create a Home Valuation Report for This Property
The Home Valuation Report is an in-depth analysis detailing your home's value as well as a comparison with similar homes in the area
Home Values in the Area
Average Home Value in this Area
Purchase History
| Date | Buyer | Sale Price | Title Company |
|---|---|---|---|
| Deem Alyssa L | -- | None Available | |
| Deem Alyssa L | -- | None Available | |
| Deem Alyssa L | $140,000 | -- | |
| Weinrieb Ft | -- | -- |
Source: Public Records
Mortgage History
| Date | Status | Borrower | Loan Amount |
|---|---|---|---|
| Open | Deem Alyssa L | $189,500 | |
| Closed | Deem Alyssa L | $189,500 | |
| Previous Owner | Deem Alyssa L | $141,414 |
Source: Public Records
Tax History Compared to Growth
Tax History
| Year | Tax Paid | Tax Assessment Tax Assessment Total Assessment is a certain percentage of the fair market value that is determined by local assessors to be the total taxable value of land and additions on the property. | Land | Improvement |
|---|---|---|---|---|
| 2024 | $5,844 | $306,600 | $79,300 | $227,300 |
| 2023 | $5,027 | $187,100 | $51,900 | $135,200 |
| 2022 | $4,678 | $187,100 | $51,900 | $135,200 |
| 2021 | $4,586 | $187,100 | $51,900 | $135,200 |
| 2020 | $4,805 | $187,100 | $51,900 | $135,200 |
| 2019 | $4,820 | $187,100 | $51,900 | $135,200 |
| 2018 | $4,554 | $153,400 | $30,400 | $123,000 |
| 2017 | $4,320 | $153,400 | $30,400 | $123,000 |
| 2016 | $4,429 | $153,400 | $30,400 | $123,000 |
| 2015 | $3,827 | $153,400 | $30,400 | $123,000 |
| 2014 | $4,037 | $153,400 | $30,400 | $123,000 |
| 2011 | $3,902 | $154,300 | $43,500 | $110,800 |
Source: Public Records
Map
Nearby Homes
- 196 Whitcomb Rd
- 24 Sawyers Crossing Rd
- 188 Sawyers Crossing Rd
- 148 Old Richmond Rd
- 66 Sugar Hill Rd
- 127 Holbrook Ave
- 1 Cherry Tree Ln
- 0 Winch Hill Rd Unit 5022598
- 626 W Swanzey Rd
- 19 Aylward Ave
- 00 Monadnock Hwy
- 14 Anthony Cir
- 15 Waters Edge Rd
- 64 Old Homestead Hwy
- 126 Monadnock Hwy
- 28 Owens Dr Unit 92
- 0 Optical Ave
- 25 Schult St
- 4 Winch Hill Rd
- 00 Graves Rd
- 9 Davis Ave
- 4 Cross St
- 14 Davis Ave Unit 16
- 11 Davis Ave
- 5 Davis Ave
- 1 Davis Ave
- 15 Davis Ave
- 3 Cross St
- 34 Talbot Hill Rd
- 121 Swanzey Lake Rd
- 38 Talbot Hill Rd
- 19 Davis Ave
- 775 Old Homestead Hwy
- 769 Old Homestead Hwy
- 23 Davis Ave
- 22 Davis Ave
- 19 Talbot Hill Rd
- 779 Old Homestead Hwy
- 15 Talbot Hill Rd
- 4 Stonefield Ln