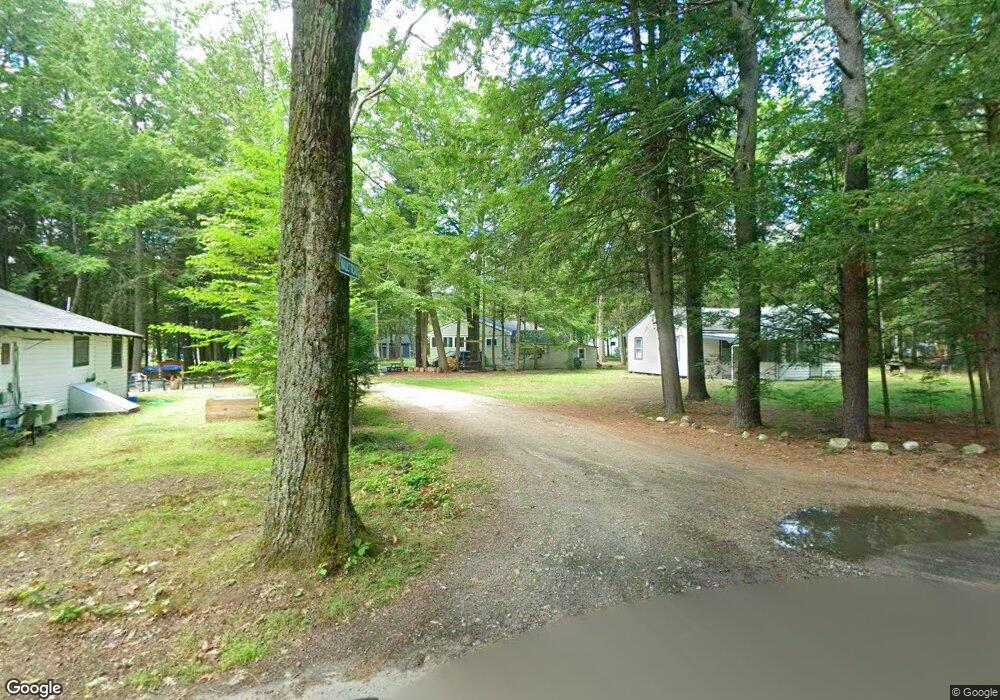
8 Deschenes Rd Rindge, NH 03461
Estimated Value: $312,000 - $365,000
3
Beds
1
Bath
1,386
Sq Ft
$246/Sq Ft
Est. Value
About This Home
This home is located at 8 Deschenes Rd, Rindge, NH 03461 and is currently estimated at $341,199, approximately $246 per square foot. 8 Deschenes Rd is a home located in Cheshire County with nearby schools including Rindge Memorial School, Conant Middle High School, and Conant High School.
Ownership History
Date
Name
Owned For
Owner Type
Purchase Details
Closed on
Apr 5, 2017
Sold by
Troiano Kathy L
Bought by
Troiano Mario and Troiano Kathy L
Current Estimated Value
Purchase Details
Closed on
Jun 19, 2003
Sold by
Walsh Marcia
Bought by
Troiano Kathy L
Home Financials for this Owner
Home Financials are based on the most recent Mortgage that was taken out on this home.
Original Mortgage
$60,000
Interest Rate
5.71%
Create a Home Valuation Report for This Property
The Home Valuation Report is an in-depth analysis detailing your home's value as well as a comparison with similar homes in the area
Home Values in the Area
Average Home Value in this Area
Purchase History
| Date | Buyer | Sale Price | Title Company |
|---|---|---|---|
| Troiano Mario | -- | -- | |
| Troiano Kathy L | $70,000 | -- |
Source: Public Records
Mortgage History
| Date | Status | Borrower | Loan Amount |
|---|---|---|---|
| Previous Owner | Troiano Kathy L | $60,000 |
Source: Public Records
Tax History Compared to Growth
Tax History
| Year | Tax Paid | Tax Assessment Tax Assessment Total Assessment is a certain percentage of the fair market value that is determined by local assessors to be the total taxable value of land and additions on the property. | Land | Improvement |
|---|---|---|---|---|
| 2024 | $3,883 | $153,400 | $50,200 | $103,200 |
| 2023 | $3,841 | $153,400 | $50,200 | $103,200 |
| 2022 | $3,376 | $146,600 | $50,200 | $96,400 |
| 2021 | $3,320 | $146,600 | $50,200 | $96,400 |
| 2020 | $3,291 | $146,600 | $50,200 | $96,400 |
| 2019 | $3,076 | $110,800 | $41,200 | $69,600 |
| 2018 | $3,047 | $110,800 | $41,200 | $69,600 |
| 2017 | $3,013 | $110,800 | $41,200 | $69,600 |
| 2016 | $3,092 | $110,800 | $41,200 | $69,600 |
| 2015 | $3,090 | $110,800 | $41,200 | $69,600 |
| 2014 | $2,655 | $102,000 | $46,800 | $55,200 |
| 2013 | $2,597 | $102,000 | $46,800 | $55,200 |
Source: Public Records
Map
Nearby Homes