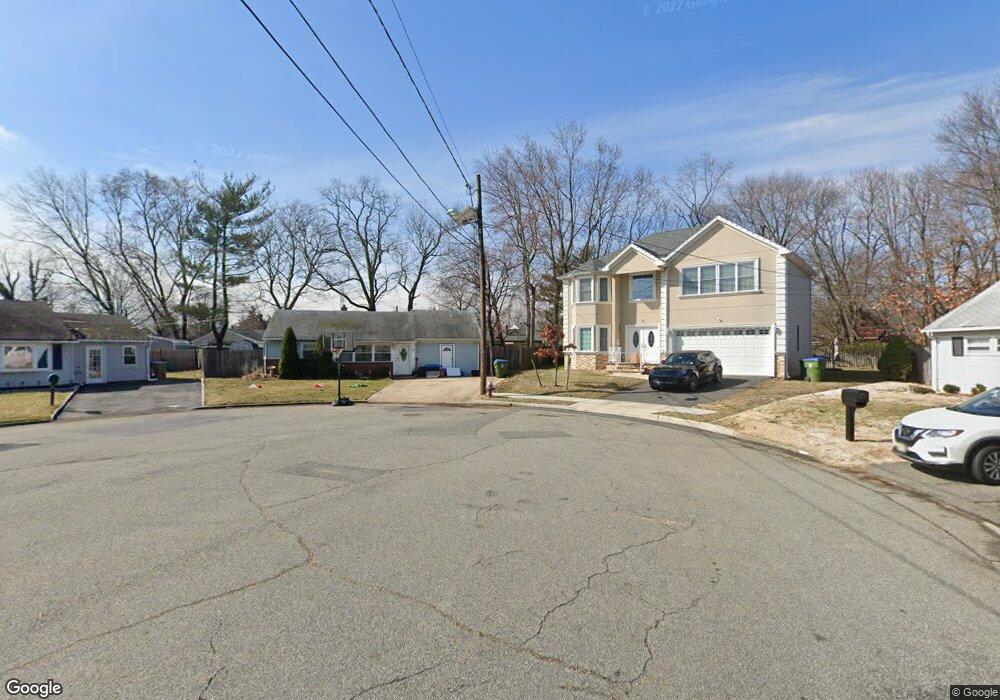
8 Dill Ct Edison, NJ 08817
Estimated Value: $521,783 - $576,000
--
Bed
--
Bath
1,545
Sq Ft
$357/Sq Ft
Est. Value
About This Home
This home is located at 8 Dill Ct, Edison, NJ 08817 and is currently estimated at $551,446, approximately $356 per square foot. 8 Dill Ct is a home located in Middlesex County with nearby schools including Lincoln Elementary School, Herbert Hoover Middle School, and Edison High School.
Ownership History
Date
Name
Owned For
Owner Type
Purchase Details
Closed on
Nov 13, 2012
Sold by
Plent Malcolm
Bought by
Moran Brian and Moran Leeana Cruz
Current Estimated Value
Home Financials for this Owner
Home Financials are based on the most recent Mortgage that was taken out on this home.
Original Mortgage
$217,550
Outstanding Balance
$150,402
Interest Rate
3.4%
Mortgage Type
New Conventional
Estimated Equity
$401,044
Purchase Details
Closed on
Jul 28, 2005
Sold by
Kregeloh Barbara
Bought by
Plent Malcolm and Plent Nancy
Home Financials for this Owner
Home Financials are based on the most recent Mortgage that was taken out on this home.
Original Mortgage
$217,500
Interest Rate
5.62%
Mortgage Type
Adjustable Rate Mortgage/ARM
Create a Home Valuation Report for This Property
The Home Valuation Report is an in-depth analysis detailing your home's value as well as a comparison with similar homes in the area
Home Values in the Area
Average Home Value in this Area
Purchase History
| Date | Buyer | Sale Price | Title Company |
|---|---|---|---|
| Moran Brian | $229,000 | None Available | |
| Plent Malcolm | $290,000 | -- |
Source: Public Records
Mortgage History
| Date | Status | Borrower | Loan Amount |
|---|---|---|---|
| Open | Moran Brian | $217,550 | |
| Previous Owner | Plent Malcolm | $217,500 |
Source: Public Records
Tax History Compared to Growth
Tax History
| Year | Tax Paid | Tax Assessment Tax Assessment Total Assessment is a certain percentage of the fair market value that is determined by local assessors to be the total taxable value of land and additions on the property. | Land | Improvement |
|---|---|---|---|---|
| 2025 | $7,709 | $129,500 | $77,500 | $52,000 |
| 2024 | $7,668 | $129,500 | $77,500 | $52,000 |
| 2023 | $7,668 | $129,500 | $77,500 | $52,000 |
| 2022 | $7,670 | $129,500 | $77,500 | $52,000 |
| 2021 | $7,644 | $129,500 | $77,500 | $52,000 |
| 2020 | $7,574 | $129,500 | $77,500 | $52,000 |
| 2019 | $7,288 | $129,500 | $77,500 | $52,000 |
| 2018 | $7,112 | $129,500 | $77,500 | $52,000 |
| 2017 | $6,962 | $129,500 | $77,500 | $52,000 |
| 2016 | $6,832 | $129,500 | $77,500 | $52,000 |
| 2015 | $6,571 | $129,500 | $77,500 | $52,000 |
| 2014 | $6,379 | $129,500 | $77,500 | $52,000 |
Source: Public Records
Map
Nearby Homes
- 29 Crescent Rd
- 13 Richmond Rd
- 64 Ashley Rd
- 23 Colfax Rd
- 5 Waverly Dr E
- 36 Sanders Rd
- 2 Avon Rd
- 38 Sturgis Rd
- 17 Ferris Rd
- 13 Markham Rd
- 6 Hector Ave
- 12 Brookville Rd
- 0-38A3 Woodedge Ave Unit 3813
- 134 Winthrop Rd
- 2 Hector Ave
- 13 Estok Rd
- 852 U S Route 1 Unit J-2
- 852 U S Route 1
- 1590 Route 27
- 11 Marie Ln