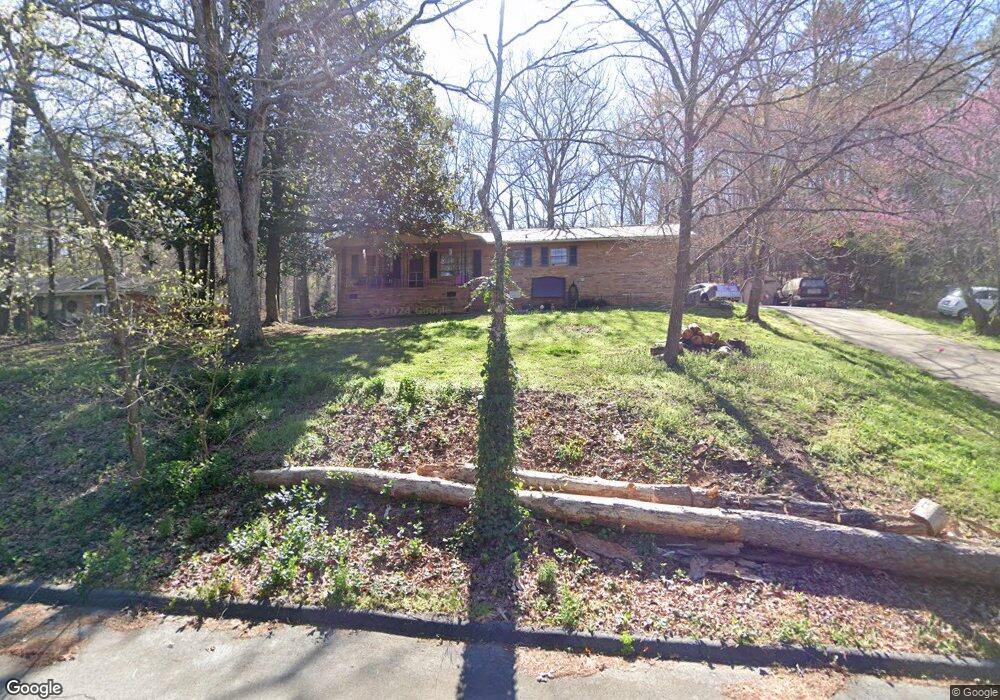
8 Drew St SE Lindale, GA 30147
Estimated Value: $160,484 - $235,000
Studio
1
Bath
1,396
Sq Ft
$143/Sq Ft
Est. Value
About This Home
This home is located at 8 Drew St SE, Lindale, GA 30147 and is currently estimated at $200,121, approximately $143 per square foot. 8 Drew St SE is a home located in Floyd County with nearby schools including Pepperell Middle School and Pepperell High School.
Ownership History
Date
Name
Owned For
Owner Type
Purchase Details
Closed on
Apr 22, 1998
Sold by
Lane Michael H and Lane Amy A
Bought by
Gabey Michael A
Current Estimated Value
Purchase Details
Closed on
Jan 13, 1995
Sold by
Burnes Cheryl A and Raymond Randall Tucker
Bought by
Lane Michael H and Lane Amy A
Purchase Details
Closed on
Mar 31, 1992
Sold by
Burnes Cheryl A
Bought by
Burnes Cheryl A and Raymond Randall T
Purchase Details
Closed on
Oct 21, 1988
Sold by
Igoe Loretta
Bought by
Burnes Cheryl A
Purchase Details
Closed on
Jun 28, 1985
Sold by
P\R
Bought by
Igoe Loretta
Purchase Details
Closed on
Jun 6, 1985
Sold by
Griffin Linda R
Bought by
P\R
Purchase Details
Closed on
Feb 17, 1976
Sold by
Griffin Terry Reese
Bought by
Griffin Linda R
Purchase Details
Closed on
Mar 3, 1972
Sold by
Burk Wm F and Lever Joseph E
Bought by
Griffin Terry Reese
Purchase Details
Closed on
Dec 4, 1969
Bought by
Burk Wm F and Lever Joseph E
Create a Home Valuation Report for This Property
The Home Valuation Report is an in-depth analysis detailing your home's value as well as a comparison with similar homes in the area
Home Values in the Area
Average Home Value in this Area
Purchase History
| Date | Buyer | Sale Price | Title Company |
|---|---|---|---|
| Gabey Michael A | $80,000 | -- | |
| Lane Michael H | $60,000 | -- | |
| Burnes Cheryl A | -- | -- | |
| Burnes Cheryl A | $48,500 | -- | |
| Igoe Loretta | $36,500 | -- | |
| P\R | -- | -- | |
| Griffin Linda R | -- | -- | |
| Griffin Terry Reese | $24,500 | -- | |
| Burk Wm F | -- | -- |
Source: Public Records
Tax History
| Year | Tax Paid | Tax Assessment Tax Assessment Total Assessment is a certain percentage of the fair market value that is determined by local assessors to be the total taxable value of land and additions on the property. | Land | Improvement |
|---|---|---|---|---|
| 2025 | $1,211 | $59,262 | $8,162 | $51,100 |
| 2024 | $1,211 | $54,572 | $7,420 | $47,152 |
| 2023 | $1,201 | $52,399 | $6,360 | $46,039 |
| 2022 | $1,029 | $41,182 | $5,300 | $35,882 |
| 2021 | $915 | $34,190 | $5,300 | $28,890 |
| 2020 | $875 | $31,887 | $4,240 | $27,647 |
| 2019 | $838 | $30,628 | $4,240 | $26,388 |
| 2018 | $768 | $26,860 | $4,240 | $22,620 |
| 2017 | $759 | $26,245 | $4,240 | $22,005 |
| 2016 | $737 | $25,120 | $4,240 | $20,880 |
| 2015 | $755 | $25,480 | $4,240 | $21,240 |
| 2014 | $755 | $26,200 | $4,240 | $21,960 |
Source: Public Records
Map
Nearby Homes
- 4803 Cedartown Hwy SE
- 938 Marion Dairy Rd
- 0 Booger Hollow Rd SW Unit 17969096
- 506 Doyle Rd SE
- 185 Marion Dairy Rd SE
- 126 E 2nd - Lindale St
- 514 Booze Mountain Rd SE
- 1380 Old Cedartown Rd SE
- 5854 Cedartown Hwy SW
- 0 College View Dr SW Unit 10655489
- 0 College View Dr SW Unit 10655483
- 5866 Hwy 27 S
- 0 John Ingram Rd SE Unit 7719851
- 0 John Ingram Rd SE Unit 10692221
- 372 Jake Whorton Rd SE
- 23 The Trail SE
- 1021 Drummond Rd
- 971 Drummond Rd
- 3667 Cave Spring Rd SW
- 0 Booze Mountain Rd Unit 10580353
- 10 Drew St SE
- 6 Drew St SE
- 7 Drew St SE
- 4 Drew St SE
- 12 Drew St SE
- 5 Drew St SE
- 11 Drew St SE
- 9 Hickory Mountain Dr SE
- 14 Drew St SE
- 5 Hickory Mountain Dr SE
- 3 Drew St SE
- 2689 Old Cedartown Hwy SE
- 7 Hickory Mountain Dr SE
- 2699 Old Cedartown Hwy SE
- 13 Drew St SE
- 2673 Old Cedartown Hwy SE
- 11 Hickory Mountain Dr SE
- 2657 Old Cedartown Hwy SE
- 3 Hickory Mountain Dr SE
- 16 Drew St SE
Your Personal Tour Guide
Ask me questions while you tour the home.