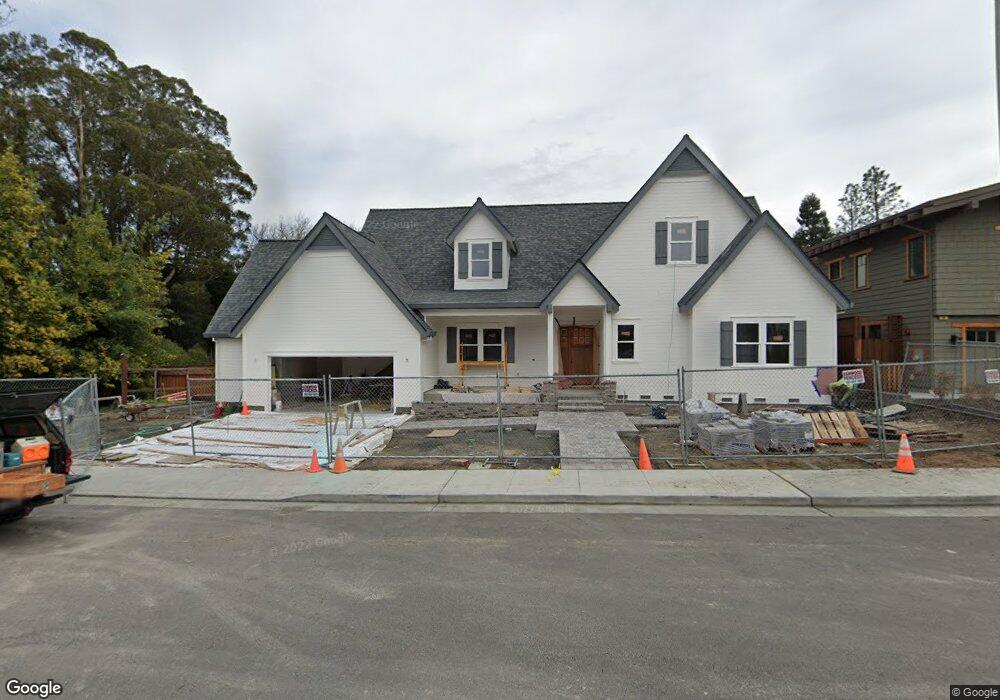
8 Eden Ln Petaluma, CA 94952
Oakhill Brewster NeighborhoodEstimated Value: $1,527,000 - $1,852,000
4
Beds
4
Baths
3,590
Sq Ft
$472/Sq Ft
Est. Value
About This Home
This home is located at 8 Eden Ln, Petaluma, CA 94952 and is currently estimated at $1,694,093, approximately $471 per square foot. 8 Eden Ln is a home with nearby schools including McKinley Elementary School, Petaluma Junior High School, and Petaluma High School.
Ownership History
Date
Name
Owned For
Owner Type
Purchase Details
Closed on
Nov 26, 2024
Sold by
Bottorff Family Trust and Bottorff Thomas E
Bought by
Bottorff Family Trust and Bottorff
Current Estimated Value
Home Financials for this Owner
Home Financials are based on the most recent Mortgage that was taken out on this home.
Original Mortgage
$830,000
Outstanding Balance
$821,519
Interest Rate
6.5%
Mortgage Type
New Conventional
Estimated Equity
$872,574
Create a Home Valuation Report for This Property
The Home Valuation Report is an in-depth analysis detailing your home's value as well as a comparison with similar homes in the area
Home Values in the Area
Average Home Value in this Area
Purchase History
| Date | Buyer | Sale Price | Title Company |
|---|---|---|---|
| Bottorff Family Trust | -- | Fidelity National Title |
Source: Public Records
Mortgage History
| Date | Status | Borrower | Loan Amount |
|---|---|---|---|
| Open | Bottorff Family Trust | $830,000 |
Source: Public Records
Tax History
| Year | Tax Paid | Tax Assessment Tax Assessment Total Assessment is a certain percentage of the fair market value that is determined by local assessors to be the total taxable value of land and additions on the property. | Land | Improvement |
|---|---|---|---|---|
| 2025 | $15,148 | $1,420,002 | $227,931 | $1,192,071 |
| 2024 | $15,148 | $1,392,160 | $223,462 | $1,168,698 |
| 2023 | $15,148 | $1,364,864 | $219,081 | $1,145,783 |
| 2022 | $14,754 | $1,338,103 | $214,786 | $1,123,317 |
| 2021 | $14,475 | $1,311,867 | $210,575 | $1,101,292 |
| 2020 | $14,600 | $638,416 | $208,416 | $430,000 |
| 2019 | $7,260 | $264,330 | $204,330 | $60,000 |
| 2018 | $3,114 | $200,324 | $200,324 | $0 |
| 2017 | $2,382 | $196,397 | $196,397 | $0 |
| 2016 | $2,321 | $192,547 | $192,547 | $0 |
| 2015 | $2,290 | $189,655 | $189,655 | $0 |
| 2014 | -- | $185,940 | $185,940 | $0 |
Source: Public Records
Map
Nearby Homes
- 716 Keller Ct
- 65 Freedom Ln N
- 513 Larch Dr
- 142 Cherry St
- 509 Larch Dr
- 12 Rain Tree Ct
- 512 Kentucky St
- 874 Cherry St
- 716 Elm Dr
- 12 Dorenfeld Ct
- 13 Dorenfeld Ct
- 136 Court St
- 131 Liberty St
- 1375 Gossage Ave
- 46 Acorn Cir
- 1252 Petaluma Blvd N
- 591 Madison St
- 66 Rio Vista Way
- 2183 Live Oak Farm Ln
- 16 7th St
Your Personal Tour Guide
Ask me questions while you tour the home.