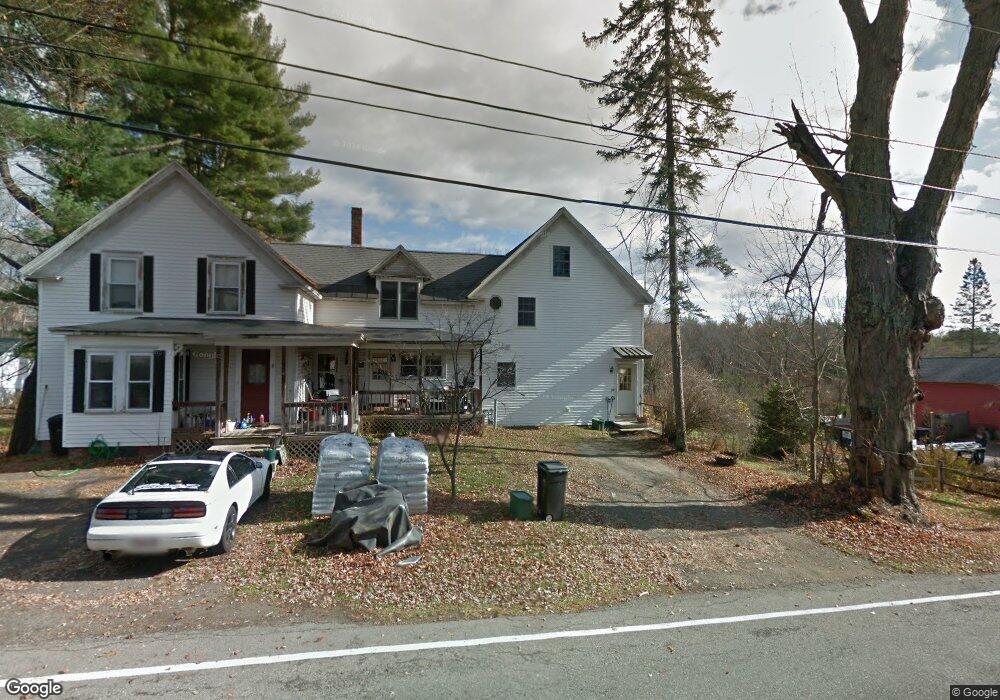
8 Elm St Pepperell, MA 01463
Estimated Value: $451,000 - $514,000
4
Beds
3
Baths
2,800
Sq Ft
$171/Sq Ft
Est. Value
About This Home
This home is located at 8 Elm St, Pepperell, MA 01463 and is currently estimated at $479,416, approximately $171 per square foot. 8 Elm St is a home located in Middlesex County with nearby schools including North Middlesex Regional High School, Pepperell Christian Academy, and Maple Dene & Moppet School.
Ownership History
Date
Name
Owned For
Owner Type
Purchase Details
Closed on
Nov 25, 2014
Sold by
Searle Kenneth E and Searle Johnnie L
Bought by
Searle Keith D and Henderson Lynne V
Current Estimated Value
Home Financials for this Owner
Home Financials are based on the most recent Mortgage that was taken out on this home.
Original Mortgage
$193,600
Outstanding Balance
$147,299
Interest Rate
4.13%
Mortgage Type
New Conventional
Estimated Equity
$332,117
Create a Home Valuation Report for This Property
The Home Valuation Report is an in-depth analysis detailing your home's value as well as a comparison with similar homes in the area
Home Values in the Area
Average Home Value in this Area
Purchase History
| Date | Buyer | Sale Price | Title Company |
|---|---|---|---|
| Searle Keith D | $242,000 | -- | |
| Searle Keith D | $242,000 | -- |
Source: Public Records
Mortgage History
| Date | Status | Borrower | Loan Amount |
|---|---|---|---|
| Open | Searle Keith D | $193,600 | |
| Closed | Searle Keith D | $193,600 | |
| Previous Owner | Searle Keith D | $100,800 | |
| Previous Owner | Searle Keith D | $70,000 |
Source: Public Records
Tax History
| Year | Tax Paid | Tax Assessment Tax Assessment Total Assessment is a certain percentage of the fair market value that is determined by local assessors to be the total taxable value of land and additions on the property. | Land | Improvement |
|---|---|---|---|---|
| 2025 | $5,145 | $351,700 | $172,400 | $179,300 |
| 2024 | $4,760 | $331,700 | $158,300 | $173,400 |
| 2023 | $4,649 | $307,100 | $133,700 | $173,400 |
| 2022 | $4,504 | $262,600 | $112,600 | $150,000 |
| 2021 | $4,281 | $238,900 | $98,500 | $140,400 |
| 2020 | $4,057 | $238,900 | $98,500 | $140,400 |
| 2019 | $3,821 | $230,300 | $98,500 | $131,800 |
| 2018 | $16,457 | $272,100 | $98,500 | $173,600 |
| 2017 | $4,325 | $272,200 | $91,500 | $180,700 |
| 2016 | $4,139 | $250,400 | $91,500 | $158,900 |
| 2015 | $4,292 | $269,100 | $91,500 | $177,600 |
| 2014 | $3,927 | $247,600 | $91,500 | $156,100 |
Source: Public Records
Map
Nearby Homes
- 14 Brookline St
- 38 River Rd Unit 11
- 39 Hollis St Unit A
- 10 Bennett St
- 28-30 Groton St
- 39 Mount Lebanon St
- 18 Maple St Unit 14
- 109 Townsend St
- 120 Townsend St Unit 1
- 120 Townsend St Unit 2
- 29 Tarbell St
- 38 Tarbell St Unit 5B
- 38 Tarbell St Unit 1D
- 114 Groton St
- 10 Boynton St
- 127 Brookline St
- 143 Heald St
- 2 Blueberry Hill Rd
- 43 Shattuck St
- 208 North St
Your Personal Tour Guide
Ask me questions while you tour the home.