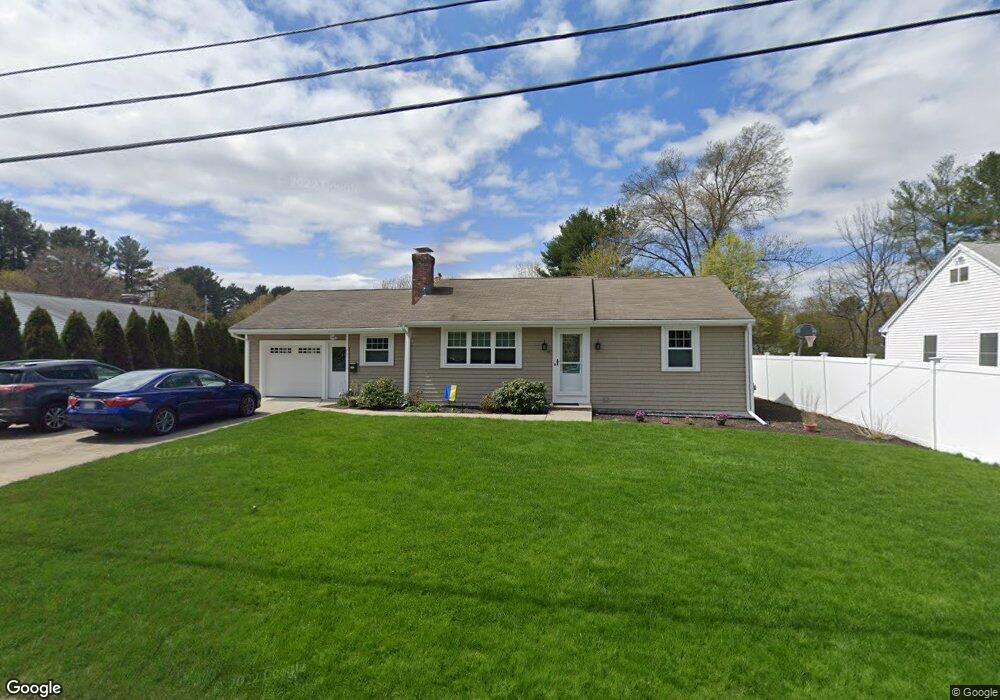
8 Elmfield Rd Framingham, MA 01701
Saxonville NeighborhoodEstimated Value: $596,000 - $680,000
3
Beds
1
Bath
1,068
Sq Ft
$597/Sq Ft
Est. Value
About This Home
This home is located at 8 Elmfield Rd, Framingham, MA 01701 and is currently estimated at $638,047, approximately $597 per square foot. 8 Elmfield Rd is a home located in Middlesex County with nearby schools including Framingham High School and MetroWest Jewish Day School.
Ownership History
Date
Name
Owned For
Owner Type
Purchase Details
Closed on
Sep 9, 2015
Sold by
Silva Gail
Bought by
Silva-Cournoyer Lt and Cournoyer
Current Estimated Value
Purchase Details
Closed on
Oct 2, 2008
Sold by
Ellis David and Ellis Susan
Bought by
Silva Gail
Home Financials for this Owner
Home Financials are based on the most recent Mortgage that was taken out on this home.
Original Mortgage
$200,000
Interest Rate
6.54%
Mortgage Type
Purchase Money Mortgage
Purchase Details
Closed on
Feb 28, 2008
Sold by
Washington Mutual Bk
Bought by
Ellis David and Ellis Susan
Purchase Details
Closed on
Feb 21, 2008
Sold by
Tibbetts James A and Washington Mutual Bk
Bought by
Washington Mutual Bk
Purchase Details
Closed on
Jan 12, 2005
Sold by
Tibbetts James and Mcnerney Jana
Bought by
Tibbetts James
Home Financials for this Owner
Home Financials are based on the most recent Mortgage that was taken out on this home.
Original Mortgage
$230,000
Interest Rate
5.81%
Mortgage Type
Purchase Money Mortgage
Create a Home Valuation Report for This Property
The Home Valuation Report is an in-depth analysis detailing your home's value as well as a comparison with similar homes in the area
Home Values in the Area
Average Home Value in this Area
Purchase History
| Date | Buyer | Sale Price | Title Company |
|---|---|---|---|
| Silva-Cournoyer Lt | -- | -- | |
| Silva-Cournoyer Lt | -- | -- | |
| Silva Gail | $312,000 | -- | |
| Silva Gail | $312,000 | -- | |
| Ellis David | $210,000 | -- | |
| Ellis David | $210,000 | -- | |
| Washington Mutual Bk | $258,926 | -- | |
| Washington Mutual Bk | $258,926 | -- | |
| Tibbetts James | -- | -- | |
| Tibbetts James | -- | -- | |
| Tibbetts James | -- | -- |
Source: Public Records
Mortgage History
| Date | Status | Borrower | Loan Amount |
|---|---|---|---|
| Previous Owner | Tibbetts James | $199,000 | |
| Previous Owner | Silva Gail | $200,000 | |
| Previous Owner | Tibbetts James | $230,000 |
Source: Public Records
Tax History Compared to Growth
Tax History
| Year | Tax Paid | Tax Assessment Tax Assessment Total Assessment is a certain percentage of the fair market value that is determined by local assessors to be the total taxable value of land and additions on the property. | Land | Improvement |
|---|---|---|---|---|
| 2025 | $6,399 | $535,900 | $264,100 | $271,800 |
| 2024 | $6,269 | $503,100 | $235,800 | $267,300 |
| 2023 | $5,949 | $454,500 | $210,500 | $244,000 |
| 2022 | $5,620 | $409,000 | $191,000 | $218,000 |
| 2021 | $5,467 | $389,100 | $183,600 | $205,500 |
| 2020 | $5,481 | $365,900 | $166,800 | $199,100 |
| 2019 | $5,371 | $349,200 | $166,800 | $182,400 |
| 2018 | $5,317 | $325,800 | $160,600 | $165,200 |
| 2017 | $5,207 | $311,600 | $155,900 | $155,700 |
| 2016 | $5,304 | $305,200 | $155,900 | $149,300 |
| 2015 | $4,961 | $278,400 | $156,100 | $122,300 |
Source: Public Records
Map
Nearby Homes
- 30 Edith Rd
- 8 Clara Rd
- 24 Pinewood Dr
- 81 Nicholas Rd Unit B
- 14 Francine Rd
- 71 Nicholas Rd Unit H
- 19 Park Ave
- 63 Landham Rd
- 0 Wagonwheel Rd
- 163 Water St
- 84 Hopestill Brown Rd
- 8 Elm St Unit 8A
- 29 Derby St
- 82 Joseph Rd
- 154 Danforth St
- 11 Danforth Park Rd
- 10 Victoria Garden Unit A
- 14 Eisenhower Rd
- 217 Central St
- 53 Davidson Rd