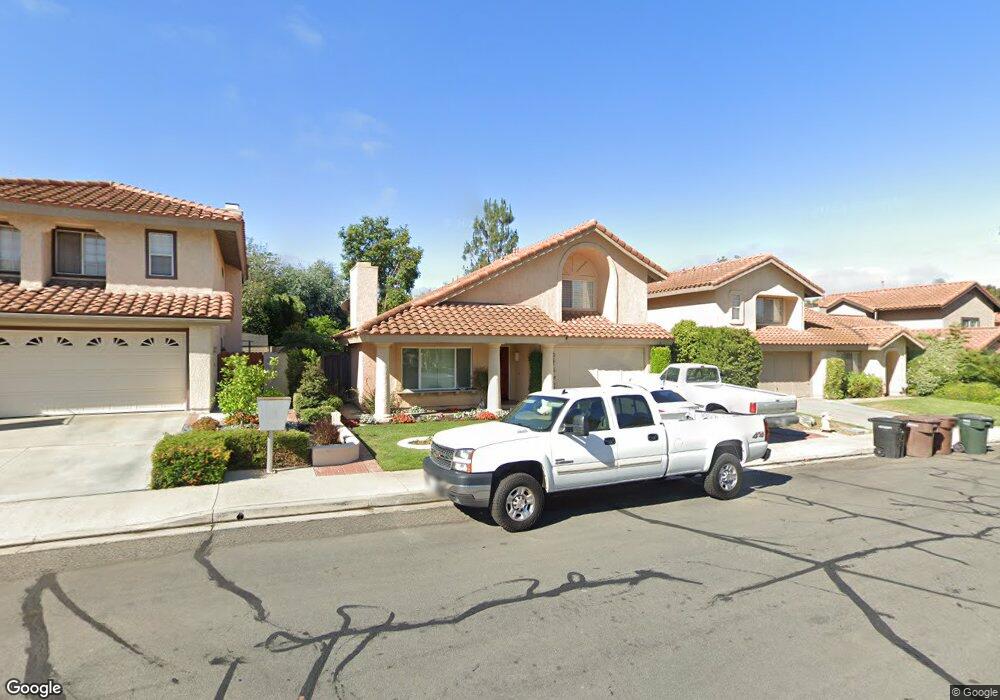
8 Eneldo Rancho Santa Margarita, CA 92688
Estimated Value: $1,005,530 - $1,071,000
3
Beds
3
Baths
1,299
Sq Ft
$807/Sq Ft
Est. Value
About This Home
This home is located at 8 Eneldo, Rancho Santa Margarita, CA 92688 and is currently estimated at $1,048,883, approximately $807 per square foot. 8 Eneldo is a home located in Orange County with nearby schools including Cielo Vista Elementary School, Rancho Santa Margarita Intermediate School, and Trabuco Hills High School.
Ownership History
Date
Name
Owned For
Owner Type
Purchase Details
Closed on
Apr 16, 2018
Sold by
Schultz Keith S
Bought by
Schultz Keith S and The Keith S Schultz Revocable Living Tru
Current Estimated Value
Purchase Details
Closed on
Aug 9, 2016
Sold by
Schultz Keith
Bought by
Schultz Keith
Purchase Details
Closed on
Sep 28, 2005
Sold by
Schultz William J
Bought by
Schultz William J and The Schultz Family Trust
Purchase Details
Closed on
Aug 15, 2003
Sold by
Schultz William J and Schultz Lavonne M
Bought by
Schultz William J and Schultz Lavonne M
Purchase Details
Closed on
Apr 29, 2003
Sold by
Schultz Keith Scott
Bought by
Schultz William J and Schultz Lavonne M
Purchase Details
Closed on
Apr 2, 2003
Sold by
Schultz William J and Schultz Lavonne M
Bought by
Schultz William J and Schultz Lavonne M
Purchase Details
Closed on
Mar 30, 1995
Sold by
Schultz William J and Schultz Lavonne M
Bought by
Schultz William J and Schultz Lavonne M
Create a Home Valuation Report for This Property
The Home Valuation Report is an in-depth analysis detailing your home's value as well as a comparison with similar homes in the area
Home Values in the Area
Average Home Value in this Area
Purchase History
| Date | Buyer | Sale Price | Title Company |
|---|---|---|---|
| Schultz Keith S | -- | None Available | |
| Schultz Keith | -- | None Available | |
| Schultz William J | -- | -- | |
| Schultz William J | -- | -- | |
| Schultz William J | -- | Commonwealth Land Title | |
| Schultz William J | -- | Commonwealth Land Title | |
| Schultz William J | -- | -- |
Source: Public Records
Tax History Compared to Growth
Tax History
| Year | Tax Paid | Tax Assessment Tax Assessment Total Assessment is a certain percentage of the fair market value that is determined by local assessors to be the total taxable value of land and additions on the property. | Land | Improvement |
|---|---|---|---|---|
| 2025 | $4,127 | $410,255 | $211,005 | $199,250 |
| 2024 | $4,127 | $402,211 | $206,867 | $195,344 |
| 2023 | $4,031 | $394,325 | $202,811 | $191,514 |
| 2022 | $3,961 | $386,594 | $198,835 | $187,759 |
| 2021 | $3,127 | $379,014 | $194,936 | $184,078 |
| 2020 | $3,853 | $375,128 | $192,937 | $182,191 |
| 2019 | $4,165 | $367,773 | $189,154 | $178,619 |
| 2018 | $4,099 | $360,562 | $185,445 | $175,117 |
| 2017 | $4,119 | $353,493 | $181,809 | $171,684 |
| 2016 | $5,860 | $437,720 | $292,431 | $145,289 |
| 2015 | $6,017 | $431,146 | $288,039 | $143,107 |
| 2014 | $4,626 | $334,671 | $172,128 | $162,543 |
Source: Public Records
Map
Nearby Homes
- 4 Raposa
- 1 El Canto
- 12 Paseo Vecino
- 4 Pica Flor Unit 54
- 31 Gaviota Unit 136
- 16 Las Piedras
- 54 Gavilan
- 15 Temecula Ct
- 73 Gaviota
- 70 Gavilan Unit 18
- 12 Paseo Fucsia
- 29 Via Pamplona Unit 78
- 87 Calle de Felicidad
- 20 Via Meseta
- 25 Dewberry
- 7 Via Cresta Unit 117
- 9 Via Cresta
- 45 Via Prado
- 71 Via Cresta
- 98 Via Barcelona