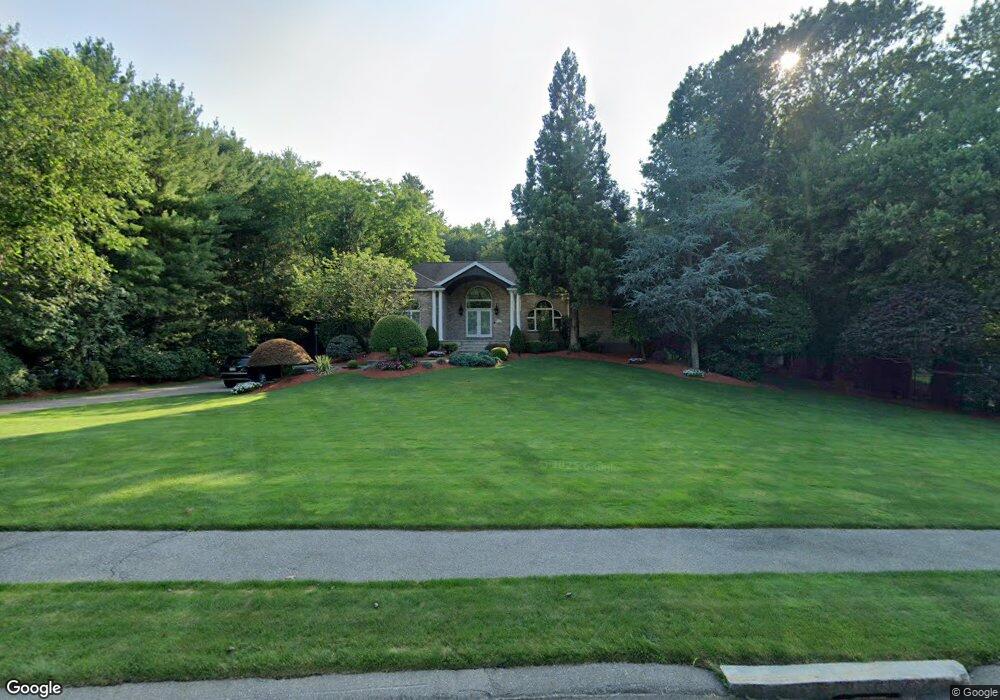
8 Erin Way Middleton, MA 01949
Estimated Value: $1,233,000 - $1,384,000
3
Beds
3
Baths
2,981
Sq Ft
$440/Sq Ft
Est. Value
About This Home
This home is located at 8 Erin Way, Middleton, MA 01949 and is currently estimated at $1,311,182, approximately $439 per square foot. 8 Erin Way is a home located in Essex County with nearby schools including Batchelder School, North Reading Middle School, and North Reading High School.
Ownership History
Date
Name
Owned For
Owner Type
Purchase Details
Closed on
Feb 21, 2007
Sold by
Goldstein Gary
Bought by
Goldstein Gary M
Current Estimated Value
Purchase Details
Closed on
May 12, 1994
Sold by
Fieldstone Place Corp
Bought by
Goldstein Gary
Create a Home Valuation Report for This Property
The Home Valuation Report is an in-depth analysis detailing your home's value as well as a comparison with similar homes in the area
Home Values in the Area
Average Home Value in this Area
Purchase History
| Date | Buyer | Sale Price | Title Company |
|---|---|---|---|
| Goldstein Gary M | -- | -- | |
| Goldstein Gary M | -- | -- | |
| Goldstein Gary | $128,000 | -- | |
| Goldstein Gary | $128,000 | -- |
Source: Public Records
Mortgage History
| Date | Status | Borrower | Loan Amount |
|---|---|---|---|
| Previous Owner | Goldstein Gary | $350,000 | |
| Previous Owner | Goldstein Gary | $176,000 | |
| Previous Owner | Goldstein Gary | $203,000 |
Source: Public Records
Tax History
| Year | Tax Paid | Tax Assessment Tax Assessment Total Assessment is a certain percentage of the fair market value that is determined by local assessors to be the total taxable value of land and additions on the property. | Land | Improvement |
|---|---|---|---|---|
| 2025 | $14,256 | $1,199,000 | $625,600 | $573,400 |
| 2024 | $13,350 | $1,132,300 | $623,600 | $508,700 |
| 2023 | $14,988 | $1,164,600 | $623,600 | $541,000 |
| 2022 | $9,506 | $717,400 | $418,500 | $298,900 |
| 2021 | $9,445 | $688,400 | $389,300 | $299,100 |
| 2020 | $8,955 | $657,500 | $355,300 | $302,200 |
| 2019 | $9,220 | $673,500 | $307,300 | $366,200 |
| 2018 | $9,902 | $709,300 | $307,300 | $402,000 |
| 2017 | $9,628 | $690,200 | $311,300 | $378,900 |
| 2016 | $9,348 | $673,000 | $325,300 | $347,700 |
| 2015 | $8,658 | $628,300 | $293,300 | $335,000 |
Source: Public Records
Map
Nearby Homes
- 14 Niblick Way
- 2 Wedge Ct Unit 2
- 6 White Ln
- 6 Cabral Dr
- 15 Rowell Ln Unit 15
- 220 Swan Pond Rd
- 67 Fuller Pond Rd
- 12 Couture Way
- 1 Couture Way
- 1 Mills Point Unit 1
- 5 Wennerberg Rd
- 20 Bellingham Ct
- 11 James Coffin Way Unit 11
- 40 Glen Dr
- 6 Greystone Dr
- 47 Maple St Unit A
- 1466 Main St
- 19 Peachey Cir
- 19 Pleasant St
- 9 Stableford Ct Unit 9
Your Personal Tour Guide
Ask me questions while you tour the home.