Estimated Value: $276,000 - $475,000
3
Beds
2
Baths
1,525
Sq Ft
$266/Sq Ft
Est. Value
About This Home
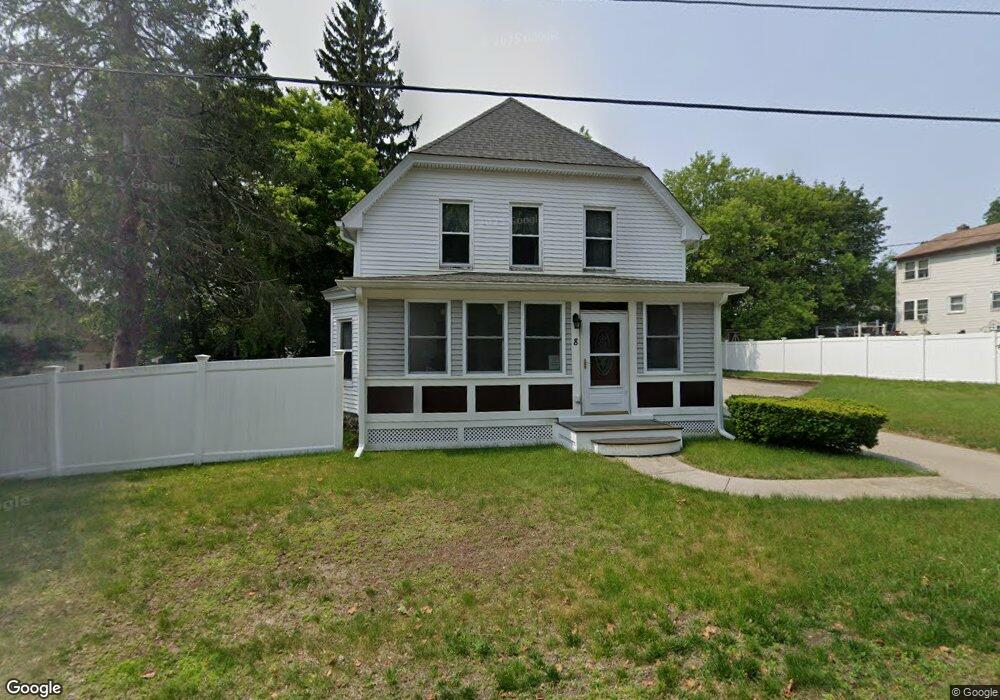
This home is located at 8 Everett St, Derry, NH 03038 and is currently estimated at $404,896, approximately $265 per square foot. 8 Everett St is a home located in Rockingham County with nearby schools including Grinnell School, Gilbert H. Hood Middle School, and Pinkerton Academy.
Ownership History
Date
Name
Owned For
Owner Type
Purchase Details
Closed on
Mar 11, 2025
Sold by
Michaud Dennis J
Bought by
Kjf Group Llc
Current Estimated Value
Home Financials for this Owner
Home Financials are based on the most recent Mortgage that was taken out on this home.
Original Mortgage
$205,000
Outstanding Balance
$203,041
Interest Rate
6.85%
Mortgage Type
Purchase Money Mortgage
Estimated Equity
$201,855
Purchase Details
Closed on
Aug 24, 1998
Sold by
Conte Richard A
Bought by
Michaud Dennis J
Home Financials for this Owner
Home Financials are based on the most recent Mortgage that was taken out on this home.
Original Mortgage
$111,145
Interest Rate
6.86%
Create a Home Valuation Report for This Property
The Home Valuation Report is an in-depth analysis detailing your home's value as well as a comparison with similar homes in the area
Home Values in the Area
Average Home Value in this Area
Purchase History
| Date | Buyer | Sale Price | Title Company |
|---|---|---|---|
| Kjf Group Llc | $278,043 | None Available | |
| Kjf Group Llc | $278,043 | None Available | |
| Michaud Dennis J | $112,000 | -- | |
| Michaud Dennis J | $112,000 | -- |
Source: Public Records
Mortgage History
| Date | Status | Borrower | Loan Amount |
|---|---|---|---|
| Open | Kjf Group Llc | $205,000 | |
| Closed | Kjf Group Llc | $205,000 | |
| Previous Owner | Michaud Dennis J | $30,000 | |
| Previous Owner | Michaud Dennis J | $239,500 | |
| Previous Owner | Michaud Dennis J | $111,145 |
Source: Public Records
Tax History
| Year | Tax Paid | Tax Assessment Tax Assessment Total Assessment is a certain percentage of the fair market value that is determined by local assessors to be the total taxable value of land and additions on the property. | Land | Improvement |
|---|---|---|---|---|
| 2025 | $7,435 | $391,500 | $202,300 | $189,200 |
| 2024 | $7,317 | $391,500 | $202,300 | $189,200 |
| 2023 | $7,126 | $344,600 | $171,900 | $172,700 |
| 2022 | $6,561 | $344,600 | $171,900 | $172,700 |
| 2021 | $6,490 | $262,100 | $127,900 | $134,200 |
| 2020 | $7,685 | $262,100 | $127,900 | $134,200 |
| 2019 | $5,684 | $217,600 | $99,800 | $117,800 |
| 2018 | $5,664 | $217,600 | $99,800 | $117,800 |
| 2017 | $6,348 | $190,800 | $86,200 | $104,600 |
| 2016 | $6,348 | $190,800 | $86,200 | $104,600 |
| 2015 | $4,829 | $165,200 | $72,600 | $92,600 |
| 2014 | $4,860 | $165,200 | $72,600 | $92,600 |
| 2013 | $4,790 | $152,100 | $68,000 | $84,100 |
Source: Public Records
Map
Nearby Homes
- 24 Jefferson St
- 5 Griffin St
- 25 Wyman St
- 29 Central St
- 32 Crystal Ave
- 6 Stonegate Ln
- 4 Stonegate Ln
- 36 Highland Ave
- 84 E Broadway
- 6 Mills Farm Cir Unit R
- 65 Fordway Extension
- 5 Magnolia Ln
- 12R Brian Ave Unit R
- 11 Phillip Rd Unit R
- 13 Sunnyside Ln Unit L
- 15 Newells Meadow Ln
- 5 Tsienneto Rd Unit 47
- 5 Tsienneto Rd Unit 136
- 8 Blueberry Rd Unit U: R
- 40 Elise Ave Unit Lot 20
Your Personal Tour Guide
Ask me questions while you tour the home.