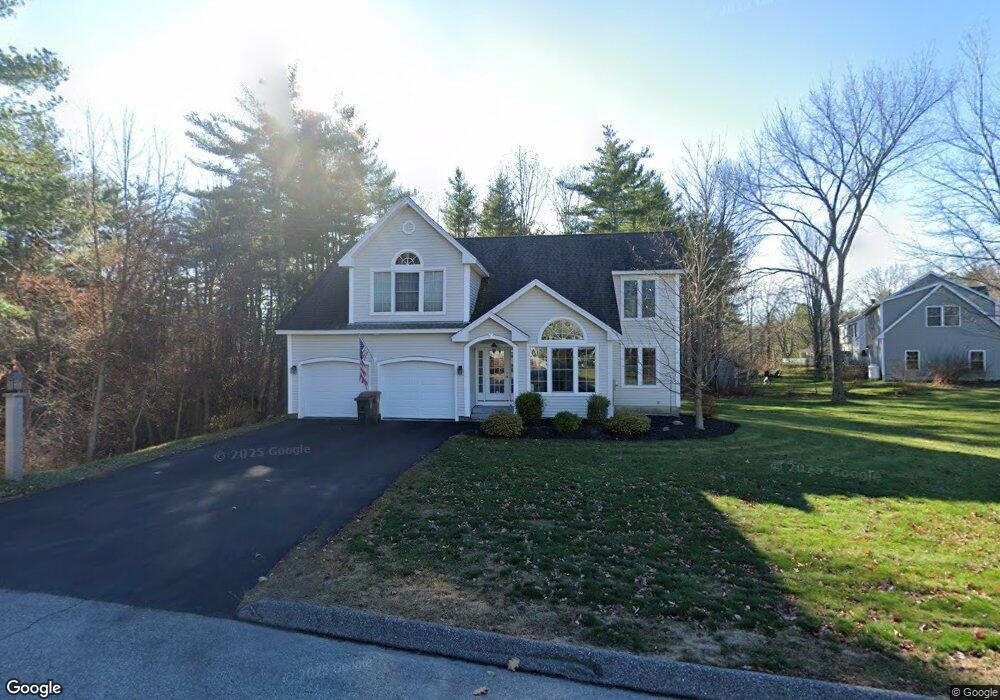
8 Evergreen Dr Saco, ME 04072
Central Saco NeighborhoodEstimated Value: $626,000 - $764,000
4
Beds
3
Baths
2,315
Sq Ft
$299/Sq Ft
Est. Value
About This Home
This home is located at 8 Evergreen Dr, Saco, ME 04072 and is currently estimated at $693,300, approximately $299 per square foot. 8 Evergreen Dr is a home located in York County with nearby schools including C K Burns School, Saco Middle School, and Saint James School.
Ownership History
Date
Name
Owned For
Owner Type
Purchase Details
Closed on
Jul 5, 2007
Sold by
Dynamic Concepts Llc
Bought by
Burgess Carol D and Burgess Dale K
Current Estimated Value
Home Financials for this Owner
Home Financials are based on the most recent Mortgage that was taken out on this home.
Original Mortgage
$50,000
Interest Rate
6.54%
Mortgage Type
Unknown
Purchase Details
Closed on
May 7, 2007
Sold by
Dynamic Concepts Llc
Bought by
Burgess Carol D and Burgess Dale K
Home Financials for this Owner
Home Financials are based on the most recent Mortgage that was taken out on this home.
Original Mortgage
$150,000
Outstanding Balance
$93,215
Interest Rate
6.39%
Mortgage Type
Purchase Money Mortgage
Estimated Equity
$600,085
Create a Home Valuation Report for This Property
The Home Valuation Report is an in-depth analysis detailing your home's value as well as a comparison with similar homes in the area
Home Values in the Area
Average Home Value in this Area
Purchase History
| Date | Buyer | Sale Price | Title Company |
|---|---|---|---|
| Burgess Carol D | -- | -- | |
| Burgess Carol D | -- | -- | |
| Burgess Carol D | -- | -- | |
| Burgess Carol D | -- | -- |
Source: Public Records
Mortgage History
| Date | Status | Borrower | Loan Amount |
|---|---|---|---|
| Open | Burgess Carol D | $50,000 | |
| Closed | Burgess Carol D | $50,000 | |
| Open | Burgess Carol D | $150,000 |
Source: Public Records
Tax History Compared to Growth
Tax History
| Year | Tax Paid | Tax Assessment Tax Assessment Total Assessment is a certain percentage of the fair market value that is determined by local assessors to be the total taxable value of land and additions on the property. | Land | Improvement |
|---|---|---|---|---|
| 2024 | $8,117 | $577,704 | $134,504 | $443,200 |
| 2023 | $8,521 | $577,704 | $134,504 | $443,200 |
| 2022 | $7,550 | $411,900 | $102,600 | $309,300 |
| 2021 | $7,246 | $383,800 | $92,600 | $291,200 |
| 2020 | $6,951 | $353,400 | $83,900 | $269,500 |
| 2019 | $6,849 | $353,400 | $83,900 | $269,500 |
| 2018 | $6,719 | $346,700 | $77,200 | $269,500 |
| 2017 | $6,789 | $350,300 | $77,200 | $273,100 |
| 2016 | $6,886 | $354,600 | $68,700 | $285,900 |
| 2015 | $6,746 | $351,000 | $68,700 | $282,300 |
| 2014 | $6,536 | $351,000 | $68,700 | $282,300 |
| 2013 | $6,522 | $351,000 | $68,700 | $282,300 |
Source: Public Records
Map
Nearby Homes